- UPSC Exam
- State PCS
- One Day Exam
- Current Affairs
- PT Quiz
- Downlaods
- About Coaching
- Blog
- Videos
| (UPSC GS Paper-3 – Environment | Urban Governance | Sustainable Development) |
India is moving rapidly toward urbanization — by 2030, nearly 40% of the country’s population will reside in cities. However, this urban growth is also generating a mountain of solid waste. Each Indian citizen generates an average of 0.45–0.5 kg of solid waste per day. Across the country, about 62 million tonnes of solid waste are generated annually —but only 70% is collected, and less than 25% is scientifically processed or disposed of. This scenario poses a major challenge for public health, the environment, and urban management.
“Waste is not a problem, it is a resource — we just need the wisdom to recognize it.”
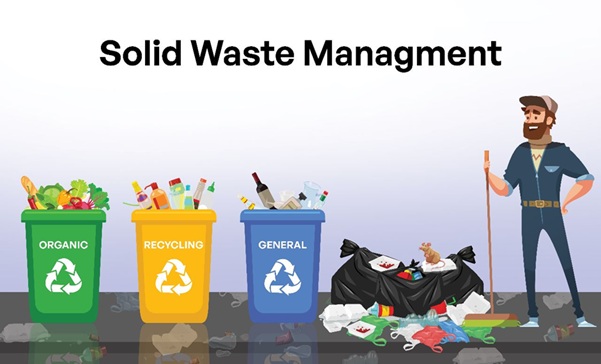
Solid Waste (SW) refers to solid materials generated from human activities that require collection, transportation, treatment, or disposal. It includes:
Solid Waste Management (SWM) is an integrated process involving collection → segregation → recycling → treatment → and safe disposal of waste materials.
|
Indicator |
Data / Facts |
|
Annual solid waste generation |
62 million tonnes (CPCB, 2023) |
|
Per capita waste generation |
0.5 kg/day (average) |
|
Collection rate |
70% |
|
Scientific disposal |
Only 27% |
|
Biodegradable fraction |
50–55% |
|
Major sources |
Household, commercial, hospital, industrial |
|
Number of landfill sites |
3,100 |
|
Number of urban local bodies (ULBs) |
4,700 (covered under SWM) |
Projection: By 2030, India’s waste generation may reach 165 million tonnes per year (NITI Aayog, 2024).
(a) Solid Waste Management Rules, 2016
Key Features:
(b) Other Related Rules
(c) Key Policy Initiatives
|
City |
Model |
Achievement |
|
Indore (Madhya Pradesh) |
Zero Waste City Model |
Ranked India’s Cleanest City for 7 consecutive years |
|
Ambikapur (Chhattisgarh) |
Source segregation by women SHGs |
90% of waste reused or recycled |
|
Pune (Maharashtra) |
SWaCH Cooperative (ragpicker organization) |
Citizen-participation-based model |
|
Surat (Gujarat) |
Waste-to-Compost & Energy Plant |
Increased municipal revenue |
|
Alappuzha (Kerala) |
Decentralized composting units |
Ward-level waste management system |
“Waste becomes a problem only where there is a lack of awareness and responsibility.”
Solid Waste Management in India is not merely a cleanliness issue — it is a matter of environmental justice and resource governance. Through sound policies, technological innovation, community participation, and a circular mindset, India can truly move toward a “Zero Waste Nation.” If every municipal body ensures source segregation and scientific processing by 2030, India could emerge as a global leader in the Zero Waste Economy.
| (Prelims: Indian Polity and Governance - Constitution, Political System) (Mains, General Studies Paper 2: Indian Constitution - Historical Underpinnings, Evolution, Features, Amendments, Significant Provisions and Basic Structure, Separation of Powers among Various Components, Dispute Redressal Mechanisms and Institutions) |
| (Preliminary Examination: Current Events of International Importance) (Mains Examination, General Studies Paper 1: Key Aspects of Art Forms, Literature, and Architecture in Indian Culture from Ancient to Modern Times) |
Recently, one of the most significant mysteries in decades has been unraveled on Failaka Island, Kuwait. A 4,000-year-old temple belonging to the mighty Bronze Age Dilmun (Dilmun/Telmun) civilization has been discovered here.

|
About Failaka Island
|
"The water crisis of the future is not merely a crisis of scarcity, but a failure to reuse."
India is the 13th most water-stressed country in the world (World Resources Institute, 2023). Major metropolitan cities — Delhi, Chennai, Bengaluru, and Hyderabad — already face severe water stress. In such a scenario, water recycling and reuse have become essential components of sustainable development. This concept forms the foundation of a Circular Water Economy — "where every drop is reused, and even wastewater becomes a resource."
|
Indicator |
Fact |
|
Share of agriculture in total water use |
85% |
|
Urban wastewater generation |
72,000 MLD (Million Litres per Day) |
|
Reuse of treated wastewater |
Only 30% |
|
India’s 2031 target |
50% reuse of wastewater |
|
Top water-stressed states |
Tamil Nadu, Rajasthan, Haryana, Maharashtra, Gujarat |
|
Global ranking (WRI) |
13th among 189 countries |
According to NITI Aayog’s Composite Water Management Index (2023) — By 2030, India’s water demand will be twice the available supply.
|
Term |
Meaning |
|
Recycling |
Treating used water and reusing it for the same purpose (e.g., industrial process water). |
|
Reuse |
Using treated wastewater for other purposes (e.g., irrigation, landscaping, cleaning). |
|
Fit-for-Purpose Approach |
Treating water only to the level required for its intended use — neither more nor less. |
|
Sector |
Example / Use |
|
Industrial |
Cooling or process water in thermal power plants, textile and refinery sectors. |
|
Urban |
Parks, green belts, road dust control, fire stations, construction works. |
|
Agriculture & Peri-urban |
Irrigation in farms around cities. |
|
Groundwater Recharge |
Discharge of treated water into percolation tanks or recharge wells. |
|
Household Level |
Use of greywater (bath, laundry) for gardening or toilet flushing. |
|
Initiative / Policy |
Objective |
|
National Water Policy (2012) |
Mandates recycling and reuse across all sectors. |
|
AMRUT Mission |
Promotes wastewater treatment and reuse in urban areas. |
|
AMRUT 2.0 |
Focuses on 100% sewage treatment and reuse. |
|
National Framework for Safe Reuse of Treated Water (2021) |
Provides guidelines and quality standards for reuse. |
|
Ministry of Jal Shakti (MoJS) |
“Reuse of Treated Wastewater” policy; target of 50% reuse. |
|
State Policies |
Tamil Nadu (2019), Gujarat (2018), Maharashtra (2020), West Bengal (2020) — implemented “Treated Wastewater Policies.” |
(1) Chennai (Tamil Nadu)
(2) Surat (Gujarat) Model
(3) New Delhi – DJB Initiative
(4) Tiruppur (Tamil Nadu)
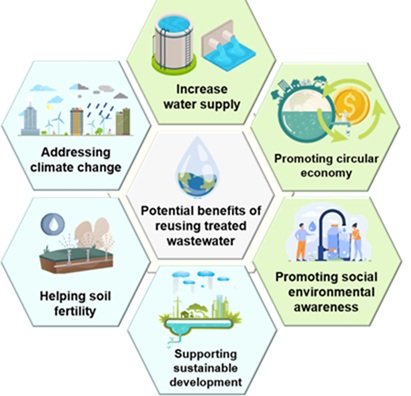
(1) Environmental Benefits
(2) Economic Benefits
(3) Social Benefits
(4) Ecological Benefits
|
Challenge |
Description |
|
Inadequate STP Capacity |
Only 40% of wastewater is treated; 60% remains untreated and flows into rivers. |
|
Lack of Standards and Monitoring |
Quality norms vary across states; weak enforcement systems. |
|
Social Reluctance |
Public perception of treated water as unsafe. |
|
Weak Financial Models |
Limited funds for operation and maintenance. |
|
Institutional Coordination Gap |
Poor coordination among municipalities, industries, and state agencies. |
|
Technological Inequality |
Lack of modern treatment facilities in Tier-2/3 cities. |
Implement Fit-for-Purpose Standards – Define quality levels for agriculture, industry, and municipal uses.
Promote Private Investment & PPP Models – Encourage “Water-as-a-Service” in industries and municipalities.
Develop Integrated Data & Monitoring Systems – Create a GIS-based “National Wastewater Inventory Portal.”
Enhance Public Awareness & Water Literacy – Launch campaigns like “Reuse Every Drop.”
Introduce Revenue-Based Incentives – Provide tax rebates to industries using treated water.
Foster Innovation – Adopt decentralized STPs, Nature-based Solutions (NBS), and constructed wetlands.
Ensure State Policy Uniformity – Formulate a “National Reuse Policy 2030” with common standards.
"If water can be reborn after every use — then the age of scarcity will turn into the age of abundance."

Our support team will be happy to assist you!

 Contact Us
  New Batch : 9555124124/ 7428085757
  Tech Support : 9555124124/ 7428085757