New
GS Foundation (P+M) - Delhi : 19th Jan. 2026, 11:30 AM Republic Day offer UPTO 75% + 10% Off, Valid Till : 28th Jan., 2026 GS Foundation (P+M) - Prayagraj : 09th Jan. 2026, 11:00 AM Republic Day offer UPTO 75% + 10% Off, Valid Till : 28th Jan., 2026 GS Foundation (P+M) - Delhi : 19th Jan. 2026, 11:30 AM GS Foundation (P+M) - Prayagraj : 09th Jan. 2026, 11:00 AM

Current Affairs for 24 January 2026

Trump’s “Board of Peace”: A New Power Forum That Puts India in a Strategic Bind

Prelims: (International Relations + CA)
Mains: (GS 2 – International Relations, Global Governance, Multilateralism, India–US Relations, West Asia)

Why in News ?

India has chosen, for now, to stay away from US President Donald Trump’s proposed Board of Peace, unveiled at the World Economic Forum in Davos, adopting a cautious “wait and watch” approach despite an invitation extended to Prime Minister Narendra Modi.

About Trump’s Board of Peace

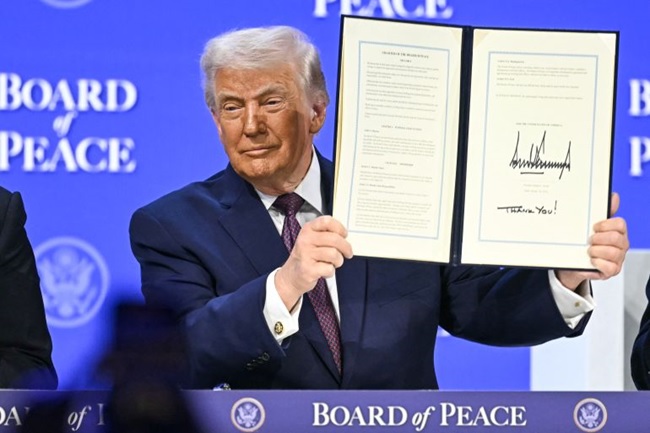
The Board of Peace is a US-led intergovernmental body designed to manage global conflict resolution and post-war reconstruction.

Origin and Purpose

  • Proposed in September 2025.
  • Created to oversee “Phase Two” of the US-brokered ceasefire in Gaza following the 2023–2025 conflict.

Immediate Mandate

  • Supervise the National Committee for the Administration of Gaza (NCAG) — a Palestinian technocratic authority.
  • Manage:
    • Gaza’s reconstruction,
    • Disarmament of Hamas,
    • Stabilisation and governance transitions.

Leadership and Composition

  • Chair: Donald Trump.
  • Key members: Jared Kushner, former UK Prime Minister Tony Blair, US Secretary of State Marco Rubio.
  • Countries that have accepted invitations: Argentina, Saudi Arabia, Israel, UAE, Egypt, Turkey, Qatar, Pakistan, Indonesia, Vietnam, among others.
  • Notable absentees: France, Germany, the UK, Italy; and permanent UNSC members — Russia, China, France, and the UK.

India’s Immediate Response on Joining the Board of Peace

  • India has neither accepted nor declined the invitation.
  • New Delhi is conducting a strategic, political, and diplomatic assessment before making a decision.
  • The official posture reflects India’s preference for measured engagement in new and untested multilateral frameworks.

Why Trump’s Board of Peace Puts India in a Tight Spot

1. An Exclusive, Pay-to-Enter Peace Club

  • Permanent membership reportedly requires a $1 billion contribution to a reconstruction fund.
  • This effectively turns peace-making into a pay-to-enter arrangement, raising concerns about:
    • Equity,
    • Legitimacy,
    • Influence-buying in global governance.

2. Unclear Scope, Expanding Concerns

  • Although Gaza is the immediate focus, the board’s charter avoids explicit territorial limits.
  • Broad phrases like “world peace” raise fears of:
    • Mission creep,
    • Expansion into other conflicts,
    • Strategic overreach beyond its original mandate.

3. Fragmented Peace-Making Outside the UN System

  • The board bypasses established multilateral institutions such as the UN General Assembly and UN Security Council.
  • Its selective membership risks:
    • Arbitrary decision-making,
    • Fragmented global peace processes,
    • Erosion of institutional legitimacy in conflict resolution.

4. India’s Multilateral Principles at Stake

  • India has consistently defended:
    • Multilateralism,
    • The primacy of the United Nations,
    • UN reform to reflect Global South realities.
  • Joining a US-led forum perceived as bypassing the UN could:
    • Undermine India’s credibility,
    • Weaken its normative leadership among developing countries.

5. The Cost of Staying Out

  • Avoiding the Board of Peace is not risk-free.
  • India seeks a seat at platforms where:
    • Global security,
    • Conflict resolution,
    • Post-war reconstruction are debated.
  • Staying out could mean:
    • Ceding strategic space,
    • Appearing passive as new power structures emerge.

6. The فلسطين–Israel Balancing Act

  • India has maintained:
    • Support for a two-state solution and Palestinian rights,
    • Deepening strategic ties with Israel.
  • Joining a West-centric, Trump-driven Gaza platform risks:
    • Upsetting this diplomatic balance,
    • Complicating India’s positioning in the Global South.

7. Sharing the Platform with Pakistan

  • Pakistan’s reported invitation presents a fresh dilemma.
  • Sharing a high-profile forum with Islamabad could:
    • Trigger domestic political backlash,
    • Conflict with India’s stance on engaging with sponsors of terrorism.
  • At the same time, staying out could exclude India from discussions affecting India–Pakistan crisis dynamics.

8. Security and Military Red Lines

  • Reports suggest Pakistan may offer troops for a Gaza stabilisation force.
  • India has ruled out participation in non-UN military missions, reinforcing its preference for:
    • UN-mandated peacekeeping,
    • Multilateral legitimacy over ad hoc coalitions.

A High-Stakes Strategic Choice

India is unlikely to ignore the platform entirely, yet joining carries reputational, diplomatic, and domestic political risks.
The strategic challenge lies in balancing engagement with caution — safeguarding India’s multilateral principles, domestic consensus, and global credibility in a Trump-led geopolitical forum.

FAQs

1. What is Trump’s Board of Peace ?

It is a US-led intergovernmental body aimed at managing post-war reconstruction and conflict resolution, starting with Gaza.

2. Why has India not joined the Board of Peace yet ?

India is assessing the strategic, diplomatic, and political implications, particularly regarding multilateralism, regional balance, and domestic considerations.

3. Why is the board controversial ?

It bypasses the UN system, has a pay-to-enter structure, and lacks clarity on its long-term mandate and geographic scope.

4. How does Pakistan’s involvement affect India’s decision ?

Sharing a high-profile peace platform with Pakistan creates domestic and strategic complications, given India’s security concerns.

5. What is at stake for India if it stays out ?

India risks losing influence in emerging global security frameworks and being excluded from key discussions on conflict resolution and reconstruction.

India’s Household Balance Sheet Under Strain: The Silent Risk Before Union Budget 2026

Prelims: (Economy + CA)
Mains: (GS 3 – Indian Economy, Growth & Development, Public Finance, Banking & Financial Stability, Governance)

Why in News?

As Union Budget 2026 approaches, India’s macroeconomic indicators project stability and relatively strong growth amid global uncertainty. However, a closer reading of RBI data (Financial Stability Report, Annual Report 2024–25) and recent Budget documents reveals a structural shift in India’s growth model — households are saving less and borrowing more, thereby absorbing risks earlier shared by the State.

household-balance-sheet

Aggregates Presenting a Partial Picture

Headline indicators suggest stability:

  • Household debt: 41.3% of GDP (March 2025), lower than peers such as:
    • China: 60.1%
    • Malaysia: 69.6%
    • Thailand: 88%
  • Trajectory: A gradual rise from ~36% (mid-2021) to 41% (2025), indicating no conventional household debt crisis.

Limitation: Debt-to-GDP ratios reveal how much debt exists, not why households are borrowing, nor their capacity to service debt under income stress.

Uneven Incomes, Stable Consumption

According to the RBI Annual Report (2024–25):

  • Real income growth has been uneven, especially outside formal, high-productivity sectors.
  • Despite this, consumption has remained resilient, suggesting households are maintaining spending through borrowing rather than income growth or savings.

Inference: Consumption stability masks underlying income fragility.

Credit as a Cushion, Not Capital

  • Shift in credit usage: Borrowing is increasingly used to bridge income–expenditure gaps, rather than to build productive assets.
  • Household vulnerability: Even moderate debt becomes risky when it substitutes for:
    • Wage growth,
    • Stable employment,
    • Household savings.

Implication: Credit is acting as a shock absorber, not as a growth accelerator.

Stock vs Flow — Where the Stress Lies

Balance Sheet Position (Stock):

  • Financial liabilities: 41.3% of GDP (March 2025)
  • Gross household financial assets: 106.6% of GDP

Households remain net holders of financial wealth, indicating no immediate balance sheet insolvency.

Flow Dynamics (Critical Insight):

  • Net financial savings: Fell to 3–4% of GDP, later rebounding to 7.6% in Q4, 2024–25.
  • Volatility driver: Liabilities growing faster than assets.

Inference: Financial wealth may still rise, but the shock-absorbing buffer is thinning, weakening household resilience to future shocks.

Why Are Households Borrowing More? (The Fiscal Angle)

At the State Level — A Quiet Transfer of Risk:

  • State Budgets 2024–25 show:
    • Priority to capital expenditure,
    • Compression of revenue expenditure.
  • Committed expenditures (interest, pensions, salaries) account for 30–32% of State revenue receipts, limiting space for:
    • Income support,
    • Countercyclical transfers.

Result: States have become fiscally leaner but less responsive to household income stress, effectively shifting risk onto households.

At the Union Level:

  • Union Budget 2025–26:
  • Capital expenditure: ₹11.2 lakh crore,
  • Effective capital expenditure: ₹15.5 lakh crore.

This strategy:

  • Boosts medium-term growth potential,
  • But does little to smooth short-term income volatility.

Conclusion: Growth-enhancing, but not household-neutral.

A Macro Risk Hiding in Plain Sight

  • Private consumption: ~60% of GDP, making households the economy’s primary stabiliser.
  • Three interacting trends:
  1. Uneven income growth,
  2. Rapid expansion of unsecured retail credit despite improved borrower profiles,
  3. Volatile and compressed net financial savings.

Risk: Any shock — income slowdown, tighter financial conditions, unemployment — could trigger abrupt consumption retrenchment, destabilising growth.

Challenges and Policy Options for Budget 2026–27

Key Challenges:

  • Rising household leverage, especially among vulnerable groups.
  • Consumption-led growth increasingly debt-financed.
  • Reduced fiscal cushioning at both State and Union levels.
  • Declining household capacity to absorb economic shocks.

Policy Options:

  1. Enhance disposable incomes:
    • Targeted income support,
    • Tax relief for middle and lower-income groups.
  2. Promote labour-intensive employment:
    • Stabilise income flows and reduce informal sector vulnerability.
  3. Rebalance fiscal policy:
    • Complement capital expenditure with selective revenue spending for income smoothing.
  4. Strengthen household savings:
    • Incentivise financial savings,
    • Reduce dependence on unsecured credit.
  5. Align growth with resilience:
    • Ensure consumption growth is backed by incomes, not debt.

FAQs

1. Why are household finances important for India’s macroeconomic stability?

Because private consumption accounts for nearly 60% of GDP, household spending acts as the economy’s primary stabiliser.

2. Is India facing a household debt crisis?

No. Household debt at 41.3% of GDP is lower than many peers, but the concern lies in why households are borrowing and their declining savings buffer.

3. What does “credit as a cushion, not capital” mean?

It means borrowing is being used to maintain consumption rather than to invest in assets or income-generating activities.

4. How have fiscal policies contributed to rising household borrowing?

Both State and Union governments have prioritised capital expenditure while compressing revenue spending, reducing income support and shifting risk to households.

5. What should Budget 2026 focus on to address this issue?

Enhancing disposable incomes, promoting job creation, strengthening household savings, and balancing capital expenditure with income-smoothing measures.

Spain Joins India’s Indo-Pacific Oceans Initiative: Expanding the Maritime Cooperation Framework

Prelims: (International Relations + CA)
Mains: (GS 2 – International Relations, Regional Groupings, Maritime Security, Indo-Pacific Strategy, Global Governance)

Why in News ?

India has recently welcomed Spain’s decision to join the Indo-Pacific Oceans Initiative (IPOI), marking the expansion of this India-led maritime cooperation framework and reinforcing growing international engagement in the Indo-Pacific region.

About the Indo-Pacific Oceans Initiative (IPOI)

The Indo-Pacific Oceans Initiative (IPOI) is a multilateral framework launched by India to promote a free, open, inclusive, and rules-based Indo-Pacific order.

Launch and Platform

  • Announced by India at the ASEAN-led East Asia Summit (EAS) in Bangkok.
  • Anchored in ASEAN centrality and the broader EAS architecture.

Nature of the Initiative

  • Non-treaty-based and voluntary in nature.
  • Does not create legally binding obligations.
  • Encourages flexible participation based on national priorities and capacities.

Core Objective

  • To promote cooperation and coordination on maritime issues.
  • To achieve greater cohesion and integration through shared understanding and collective action on common interests.

Institutional Framework and Working Mechanism

  • The IPOI leans heavily on the East Asia Summit (EAS) mechanism, which comprises:
    • 10 ASEAN member states, and
    • 8 Dialogue Partners (India, China, Japan, South Korea, Australia, New Zealand, Russia, and the United States).
  • It follows a pillar-based approach, where:
    • One or two countries act as lead partners for each pillar.
    • Other countries join voluntarily, ensuring inclusivity and flexibility.

The Seven Pillars of IPOI and Lead Countries

The IPOI is structured around seven thematic pillars, each addressing a core maritime challenge:

1. Maritime Security

Leads: India and the United Kingdom (UK) Focuses on:

  • Freedom of navigation,
  • Counter-piracy,
  • Maritime domain awareness,
  • Upholding international maritime law (UNCLOS).

2. Maritime Ecology

Leads: Australia and Thailand Addresses:

  • Marine pollution,
  • Biodiversity conservation,
  • Climate change impacts on oceans,
  • Sustainable ocean governance.

3. Maritime Resources

Leads: France and Indonesia Covers:

  • Sustainable fisheries,
  • Blue economy development,
  • Responsible seabed resource use,
  • Marine biotechnology.

4. Capacity Building and Resource Sharing

Lead: Germany Aims at:

  • Enhancing institutional capabilities,
  • Sharing best practices,
  • Supporting smaller and developing maritime states.

5. Disaster Risk Reduction and Management

Leads: India and Bangladesh Focuses on:

  • Early warning systems,
  • Humanitarian assistance and disaster relief (HADR),
  • Regional preparedness for cyclones, tsunamis, and climate-induced disasters.

6. Science, Technology, and Academic Cooperation

Leads: Italy and Singapore Promotes:

  • Ocean science research,
  • Technology exchange,
  • Academic networks and data sharing.

7. Trade, Connectivity, and Maritime Transport

Leads: Japan and the United States (US) Addresses:

  • Resilient maritime supply chains,
  • Port connectivity,
  • Shipping efficiency,
  • Infrastructure standards and safety.

Significance of Spain Joining the IPOI

Spain’s participation:

  • Expands IPOI beyond its initial core partners, enhancing European engagement in the Indo-Pacific.
  • Strengthens:
    • Maritime governance cooperation,
    • Blue economy linkages,
    • Multilateral rule-making.
  • Reinforces India’s role as a norm-shaper and agenda-setter in the Indo-Pacific maritime domain.

Strategic Relevance for India and the Indo-Pacific

  • The IPOI complements India’s broader Indo-Pacific vision, which emphasises:
    • Inclusivity,
    • Transparency,
    • ASEAN centrality,
    • Respect for international law.
  • It offers an alternative to exclusive or bloc-based regional architectures, favouring functional cooperation over strategic alignment.
  • By focusing on practical maritime issues rather than military alliances, IPOI enhances trust-building and regional stability.

FAQs

1. What is the Indo-Pacific Oceans Initiative (IPOI) ?

It is an India-led, voluntary, non-treaty-based framework aimed at promoting cooperation for a free, open, and rules-based Indo-Pacific maritime order.

2. Where was IPOI launched ?

It was launched at the ASEAN-led East Asia Summit (EAS) in Bangkok.

3. How many pillars does IPOI have ?

IPOI has seven thematic pillars covering security, ecology, resources, disaster management, science, capacity building, and connectivity.

4. Why is Spain joining IPOI significant ?

Spain’s participation broadens European engagement, strengthens maritime cooperation, and enhances the initiative’s global legitimacy.

5. How does IPOI differ from military alliances in the Indo-Pacific ?

Unlike military blocs, IPOI is inclusive, voluntary, and issue-based, focusing on functional maritime cooperation rather than strategic alignment.

Delhi Winter Smog Explained: CAQM Flags Secondary Particulates as the Biggest Polluter

Prelims: (Environment + CA)
Mains: (GS 3 – Environment, Pollution, Climate Change, Public Health, Governance)

Why in News?

A recent synthesis report by the Commission for Air Quality Management (CAQM) has identified secondary particulate matter as the single largest contributor to Delhi’s winter air pollution, reshaping the understanding of pollution sources and policy priorities in the National Capital Region (NCR).

Background: Understanding Delhi’s Air Pollution Challenge

CAQM

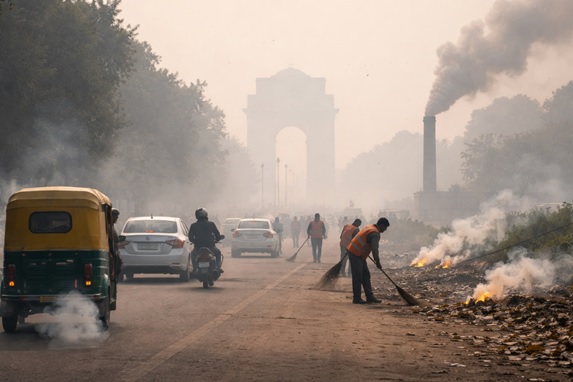
Delhi and the NCR experience severe air pollution every winter due to a complex interplay of:

  • Meteorological factors: Low wind speeds, temperature inversion, and high moisture levels trap pollutants close to the surface.
  • Geographical factors: Landlocked terrain and proximity to major agricultural and industrial belts.
  • Emission-related factors: High vehicular density, industrial activities, biomass burning, construction dust, and energy use.

Over the years, numerous scientific studies have attempted to apportion pollution sources. However, differences in data sets, methodologies, and time frames led to conflicting estimates, making it difficult to design targeted interventions.

To bridge this gap, the CAQM undertook a meta-analysis of existing peer-reviewed studies, producing a consolidated and evidence-based assessment of pollution sources affecting Delhi during the winter months.

Key Findings of the CAQM Synthesis Report

The report provides a source-wise contribution to Delhi’s winter air pollution:

  • Secondary particulate matter: 27%
  • Transport emissions: 23%
  • Biomass burning (crop residue + municipal waste): 20%
  • Dust (road and construction): 15%
  • Industrial emissions: 9%

Importantly, the report notes that:

  • No new pollution sources have emerged.
  • The findings harmonise earlier studies, offering a unified scientific basis for policymaking and regulatory action.

Secondary Particulate Matter as the Dominant Pollutant

Unlike primary pollutants that are directly emitted, secondary particulate matter forms in the atmosphere through chemical reactions involving:

  • Sulphur dioxide (SO₂)
  • Nitrogen oxides (NOx)
  • Ammonia (NH₃)

These react to form sulphates and nitrates, which together constitute nearly 25–60% of PM2.5 concentrations during winter.

Why this matters:

  • These fine particles penetrate deep into the lungs and bloodstream, exacerbating respiratory, cardiovascular, and eye diseases.
  • The CAQM report stresses that controlling only visible emission sources (like vehicles or chimneys) is insufficient unless the underlying chemical processes are also addressed.

Role of Ammonia in Pollution Formation

Ammonia plays a critical enabling role in the formation of secondary particulate matter.

  • Nearly 80% of ammonia emissions in India originate from:
    • Fertiliser application
    • Livestock excreta
  • In the atmosphere, ammonia reacts with sulphuric and nitric acids (from SO₂ and NOx) to form:
    • Ammonium sulphate
    • Ammonium nitrate aerosols

These compounds significantly increase PM2.5 levels during winter, highlighting the rural–urban linkage in Delhi’s air pollution problem and the need to integrate agricultural practices into air quality governance.

Transport, Biomass Burning, and Dust Contributions

1. Transport Emissions (23%)

  • High vehicle density, fossil fuel dependence, and traffic congestion make transport the second-largest contributor.
  • Emissions include NOx, PM, and hydrocarbons, which also act as precursors to secondary particles.

2. Biomass Burning (20%)

  • Includes:
    • Crop residue burning in neighbouring States
    • Municipal waste burning
  • Contributions spike during harvest seasons, compounding winter pollution episodes.

3. Dust Pollution (15%)

  • Originates from:
    • Unpaved roads
    • Construction activities
    • Resuspension of settled particles
  • Often underestimated, but becomes significant under stagnant winter conditions.

Policy Implications and Future Directions

The CAQM report has far-reaching implications for air quality management:

  • Multi-sectoral approach: Pollution control must integrate agriculture, transport, energy, industry, and waste management.
  • Integrated emission inventories: Calls for updated and harmonised emission databases.
  • Updated source apportionment studies: Proposed 2026 as the base year for new scientific assessments.
  • Improved forecasting systems: The findings will strengthen Air Quality Early Warning Systems and Decision Support Systems, which previously faced limitations in predicting pollution spikes.
  • Science-driven governance: A shift toward evidence-based policymaking is expected to enhance both preventive and responsive interventions.

FAQs

1. What is the CAQM synthesis report?

It is a consolidated scientific assessment by the Commission for Air Quality Management that harmonises multiple studies to identify the major contributors to Delhi’s winter air pollution.

2. Which pollutant contributes the most to Delhi’s winter air pollution?

Secondary particulate matter, contributing about 27%, is the largest single contributor.

3. Why is ammonia important in air pollution formation?

Ammonia reacts with SO₂ and NOx to form sulphates and nitrates, which significantly increase PM2.5 levels, especially during winter.

4. How significant are transport and biomass burning compared to secondary particles?

Transport contributes 23%, biomass burning 20%, while secondary particles remain the largest at 27%.

5. Why is the CAQM report significant for policymaking?

It provides a unified scientific basis for targeted, multi-sectoral interventions and strengthens forecasting and governance mechanisms for air quality management.

Draft National Electricity Policy 2026 Charts India’s Low-Carbon, High-Growth Power Future

Prelims: (Polity & Governance + CA)
Mains: (GS 3 – Infrastructure, Energy, Climate Change, Economic Development, Governance)

Why in News?

The Ministry of Power has released the Draft National Electricity Policy (NEP) 2026, outlining a comprehensive roadmap to overhaul India’s power sector in line with the vision of Viksit Bharat @2047.

Once finalised, the policy will replace the National Electricity Policy, 2005, reflecting two decades of transformation in energy demand, technology, market structures, and climate priorities.

From Shortages to Scale: How the Power Sector Has Evolved

national-electricity-policy

Early Challenges (Pre-2005)

  • The 2005 NEP focused on:
    • Chronic power shortages,
    • Limited electricity access,
    • Weak generation and transmission infrastructure.

Transformation Since 2005

  • Installed generation capacity has grown nearly fourfold, driven by strong private sector participation.
  • Universal electrification was achieved by March 2021.
  • A unified national grid became operational in 2013, enabling seamless power transfers across regions.
  • Per capita electricity consumption rose to 1,460 kWh in 2024–25.
  • The emergence of power markets and exchanges improved procurement efficiency, flexibility, and price discovery.

Persistent Stress Points

Despite progress, structural issues remain, particularly in the distribution segment:

  • High accumulated losses,
  • Mounting debt of DISCOMs,
  • Non–cost-reflective tariffs,
  • Heavy cross-subsidisation, raising industrial tariffs and hurting global competitiveness.

Draft NEP 2026: Ambitious Consumption and Climate Goals

The Draft NEP 2026 sets forward-looking national targets:

  • Per capita electricity consumption:
    • 2,000 kWh by 2030,
    • Over 4,000 kWh by 2047.
  • Climate alignment:
    • 45% reduction in emissions intensity from 2005 levels by 2030,
    • Net-zero emissions by 2070.

These goals signal a decisive shift toward a low-carbon, reliable, and resilient power system.

Draft National Electricity Policy 2026: Key Interventions at a Glance

The Draft NEP 2026 proposes wide-ranging reforms across planning, tariffs, markets, generation, grids, and technology.

1. Resource Adequacy Planning

  • Decentralised planning:
    • DISCOMs and State Load Despatch Centres (SLDCs) to prepare utility- and state-level Resource Adequacy (RA) plans under State Commission regulations.
  • National coordination:
    • Central Electricity Authority (CEA) to prepare a national RA plan to ensure countrywide capacity adequacy.

2. Financial Viability and Economic Competitiveness

  • Automatic tariff revision: Linking tariffs to a suitable index for annual revision if State Commissions fail to issue tariff orders.
  • Cost-reflective tariffs: Progressive recovery of fixed costs through demand charges to reduce cross-subsidisation.
  • Cross-subsidy exemptions: Removal of cross-subsidies and surcharges for manufacturing, railways, and metro railways to lower logistics costs and improve industrial competitiveness.
  • Large consumers: Possible exemption of distribution licensees from Universal Service Obligation for consumers with contracted load of 1 MW and above.
  • Faster dispute resolution: Strengthening mechanisms to reduce regulatory burden and lower costs.

3. Renewable Energy Generation and Storage

  • Market-based capacity addition:
    • Greater reliance on markets and captive power plants for renewable expansion.
  • Distributed Renewable Energy (DRE):
    • DISCOM-led storage for small consumers to achieve economies of scale.
    • Bulk consumers to install their own storage systems.
  • Energy trading:
    • Peer-to-peer (P2P) trading of surplus DRE and stored energy, directly or via aggregators.
  • Scheduling parity:
    • Equal treatment of renewable and conventional power in scheduling and deviation mechanisms by 2030.
  • Market deployment of storage:
    • Promotion of Battery Energy Storage Systems (BESS),
    • Domestic manufacturing of cells and components,
    • Incentives such as Viability Gap Funding (VGF) for BESS and pumped storage.

4. Thermal Power: Supporting the Energy Transition

  • Grid support role:
    • Integration of storage and repurposing of older thermal units to support grid stability and renewable integration.
  • Efficiency gains:
    • Exploring direct use of steam from thermal plants for district cooling and industrial processes.

5. Nuclear Energy Expansion

  • Advanced technologies:
    • Adoption of advanced nuclear technologies, modular reactors, and small reactors in line with the SHANTI Act, 2025.
  • Long-term target:
    • Scaling nuclear capacity to 100 GW by 2047, including use by commercial and industrial consumers.

6. Hydropower Development

  • Storage-based hydro:
    • Fast-tracking storage hydro projects for:
      • Flood moderation,
      • Irrigation,
      • Water security,
      • Energy security.

7. Power Markets and Competition

  • Market oversight:
    • Strong regulatory framework for monitoring and surveillance to prevent:
      • Collusion,
      • Gaming,
      • Market dominance.

8. Transmission Reforms

  • Right of Way (RoW):
    • Use of advanced technologies and appropriate land-use compensation to address RoW challenges.
  • Tariff parity:
    • Equal transmission tariff treatment for renewable and conventional power by 2030.
  • Efficient access:
    • Utilisation-based allocation of transmission connectivity to prevent speculative hoarding.

9. Distribution System Reforms

  • Loss reduction:
    • Targeting single-digit Aggregate Technical and Commercial (AT&C) losses.
  • Network sharing:
    • Shared distribution networks to enhance competition and avoid duplication of infrastructure.
  • Distribution System Operator (DSO):
    • Establishment of DSOs to integrate distributed renewables, storage, and Vehicle-to-Grid (V2G) systems.
  • Urban reliability:
    • N-1 redundancy at distribution transformer level in cities with population above 10 lakh by 2032.
    • Undergrounding of networks in congested urban areas.

10. Grid Operations and Governance

  • Institutional reform:
    • Functional unbundling of State Transmission Utilities.
    • Creation of independent entities for SLDC operations and transmission planning.
  • Regulatory alignment:
    • Harmonisation of State Grid Codes with the Indian Electricity Grid Code issued by CERC.

11. Cybersecurity and Data Sovereignty

  • Cyber resilience:
    • Establishment of a robust cybersecurity framework for the power sector.
  • Data localisation:
    • Mandatory storage of power sector data within India to ensure sovereignty and system security.

12. Data Sharing and Visibility

  • Transparent data framework:
    • Sharing of operational and market data under a central government-prescribed framework.
  • Real-time monitoring:
    • Ensuring real-time visibility of Distributed Energy Resources for DISCOMs and SLDCs.

13. Technology and Skill Development

  • Indigenous systems:
    • Transition to domestically developed SCADA systems by 2030.
  • Software self-reliance:
    • Development of Indian software solutions for all critical power system applications.

FAQs

1.What is the Draft National Electricity Policy 2026?

It is a comprehensive policy framework released by the Ministry of Power to guide the transformation of India’s power sector in line with long-term growth and climate goals.

2. What policy will it replace?

It will replace the National Electricity Policy, 2005.

3. What are the consumption targets under the Draft NEP 2026?

Per capita electricity consumption is targeted at 2,000 kWh by 2030 and over 4,000 kWh by 2047.

4. How does the policy support renewable energy and storage?

Through market-based capacity addition, promotion of BESS and pumped storage, peer-to-peer energy trading, and incentives like Viability Gap Funding.

5. Why is the Draft NEP 2026 significant?

It integrates energy security, financial sustainability, market competition, and climate commitments into a unified roadmap for India’s power sector transformation.

« »
  • SUN
  • MON
  • TUE
  • WED
  • THU
  • FRI
  • SAT
Have any Query?

Our support team will be happy to assist you!

OR