New
Hindi Medium: (Delhi) - GS Foundation (P+M) : 8th June 2026, 6:30 PM Hindi Medium: (Prayagraj) - GS Foundation (P+M) : 1st June 2026, 5:30 PM English Medium: (Prayagraj) - GS Foundation (P+M) : 7th June 2026, 8:00 AM Hindi Medium: (Delhi) - GS Foundation (P+M) : 8th June 2026, 6:30 PM Hindi Medium: (Prayagraj) - GS Foundation (P+M) : 1st June 2026, 5:30 PM English Medium: (Prayagraj) - GS Foundation (P+M) : 7th June 2026, 8:00 AM

Current Affairs for 19 May 2026

Demographic Change in India: Theory and Developmental Implications

Why in Discussionv?

  • Recently, the Chief Minister of N. Chandrababu Naidu announced financial incentives to increase the birth rate in the state in view of the declining population growth rate and the possibility of an ageing population crisis in the future.
  • Under this proposal, financial assistance of ₹30,000 for the third child and ₹40,000 for the fourth child has been suggested.
  • Earlier, a proposal to provide an incentive of ₹25,000 for the birth of the second child was also discussed. This decision is considered important in the context of declining fertility rates and changing population structures in the southern states of India.

Demographic Transition Theory (DTT)

  • Demographic Transition Theory (DTT) explains how the population structure of a country changes over time. The theory shows that with economic development, industrialisation, urbanisation, education, healthcare improvements and a higher standard of living, a society gradually moves from a stage of high birth rates and high death rates to low birth rates and low death rates.
  • The theory primarily explains the relationship between population growth and economic development and helps understand why differences exist between the population structures of developing and developed countries.

Pioneers of the Theory

  • The theory was first proposed by Warren S. Thompson in 1929 through the study of population growth patterns in different countries. Later, Frank W. Notestein in 1945 provided a more systematic framework and clarified the relationship between economic development and demographic change.

Stages of Demographic Transition Theory

1. High Stationary Stage

  • In this stage, both birth rate and death rate remain very high, resulting in very low or almost stable population growth.
  • Due to lack of healthcare facilities, malnutrition, epidemics, famine, wars and poor sanitation, mortality remains high.
  • Society is mainly agrarian and children are viewed as economic resources and labour force; therefore, birth rates also remain high.
  • This stage is generally associated with primitive or pre-industrial societies.

2. Early Expanding Stage

  • In this stage, improvements begin in healthcare facilities, sanitation, nutrition and food security, leading to a rapid decline in death rates.
  • Birth rates remain high because social traditions and family structures do not change immediately.
  • As a result, population growth becomes very rapid and may lead to a population explosion.
  • Many developing countries experienced this stage during the twentieth century.

3. Late Expanding Stage

  • In this phase, birth rates begin to decline due to expansion of education, urbanisation, women’s empowerment and family planning.
  • Families become smaller and children are increasingly viewed as social and economic responsibilities rather than economic assets.
  • Women’s participation in the workforce increases and the age of marriage and motherhood rises.
  • Population growth continues but at a slower pace compared to earlier stages.

4. Low Stationary Stage

  • In this stage, both birth rate and death rate reach low levels, causing population growth to become almost stable.
  • High standards of living, better healthcare services, advanced education systems and developed economies are its major characteristics.
  • Life expectancy increases and the proportion of elderly population gradually rises.
  • Most developed countries are currently in this stage.

5. Declining Population Stage

  • In this stage, fertility rates fall below replacement level, meaning that the new generation is unable to fully replace the older generation.
  • The proportion of elderly population rises rapidly while the working-age population begins to decline.
  • Challenges such as labour shortages, pressure on social security systems, pension burdens and slower economic growth start emerging.
  • Several states in southern India appear to be moving towards this stage due to low fertility rates.

Replacement Fertility Rate

  • Replacement fertility rate refers to the average number of children a woman must have so that she and her partner are replaced in the population and the overall population remains stable.
  • India’s replacement fertility rate is considered to be approximately 2.1.
  • In contrast, the fertility rate in many southern Indian states has declined to around 1.5, which is below replacement level.
  • Persistently low fertility rates may lead to population ageing, labour shortages and economic challenges in the future.

Implications of Demographic Transition on India

1. Inter-State Demographic Divergence

  • The pace of demographic transition is not uniform across Indian states, leading to regional disparities.
  • States such as Bihar and Uttar Pradesh have a larger young population, providing greater opportunities to benefit from the demographic dividend.
  • In contrast, southern states are witnessing a rapid increase in the elderly population due to lower fertility rates.
  • This divergence may affect labour markets, development patterns and resource distribution in the future.

2. Changing Dependency Ratio

  • India’s elderly population is continuously increasing and its impact is expected to become more evident in coming decades.
  • It is estimated that by 2050, one out of every five Indians may be aged 60 years or above.
  • The elderly population may rise from around 149 million to 347 million.
  • This will place significant pressure on social security systems, healthcare infrastructure, elderly care services and pension arrangements.

3. Fiscal Implications

  • In ageing states, the decline in working-age population may reduce the number of taxpayers and weaken the tax base.
  • Government expenditure on pensions, healthcare services and social security programmes is likely to increase.
  • Higher public expenditure combined with limited revenue may lead to rising fiscal deficits and debt burdens.
  • This could affect long-term economic stability and development planning.

4. Political Implications

  • Differences in population growth among states may influence political representation in the future.
  • After delimitation, states with higher population growth may receive greater representation in Parliament.
  • States with lower fertility rates fear that despite successfully controlling population growth, their political representation may decline.
  • This situation could have broader implications for India’s federal structure and regional balance.

Population Incentive Policy of Andhra Pradesh

  • The government of Andhra Pradesh has adopted a policy to encourage population growth in view of declining fertility rates and the possibility of future labour shortages.
  • Under the proposed scheme, incentives of ₹25,000 for the second child, ₹30,000 for the third child and ₹40,000 for the fourth child may be provided.
  • N. Chandrababu Naidu stated that increasing birth rates is necessary to maintain an adequate working-age population in the future.
  • The policy is being viewed as an effort to address the challenge of an ageing population and declining fertility rates in southern India.

Anaimangalam Copper Plates

Context

  • The famous Anaimangalam copper plates from the Chola period were recently brought back to India from the Netherlands. Historians and archaeologists have described this as a significant achievement in the history of the return of India's cultural heritage. For nearly two hundred years, these copper plates were preserved at Leiden University in the Netherlands and were known as the Leiden copper plates.

About the Anaimangalam Copper Plates

  • According to Chola history scholars, the Anaimangalam copper plates are important evidence of Tamil history, culture, and the greatness of the Chola Empire.
  • These copper plates date back to the reign of Raja Raja Chola I (985–1014 AD) and his son Rajendra Chola I (1014–1044 AD).
  • The inscriptions mention the donation of land to a Buddhist monastery in Anaimangalam village, near Nagapattinam.
  • This monastery was built by the Javanese king Sri Mara Vijayotunga Varman in memory of his father, Chudamani Varman, and hence, it was named Chudamani Varman Vihara.

Copper Plates Symbolize Religious Tolerance

  • The most striking feature of these copper plates is that they exemplify religious tolerance. The Chola rulers were followers of Shaivism, yet they supported the construction of the Buddhist monastery.
  • Raja Raja Chola I ordered the construction of the monastery, while his son Rajendra Chola I implemented the order. Later, Kulottunga Chola I also granted additional land and paddy to the monastery.

Features of the Copper Plates

  • These copper plates are a collection of 24 plates, including 21 large and 3 small plates.
  • The larger plates contain inscriptions in both Sanskrit and Tamil.
  • The smaller plates mention additional grants made during the reign of Kulothunga Chola I.
  • These plates were strung on special metal rings bearing the royal emblems of the Chola Empire. These included :
    • The Chola tiger
    • The two fishes of the Pandyas
    • The Chera bow
    • The royal umbrella
    • The lamp
    • The swastika symbol.
  • The two fishes and the bow symbolized the Chola victory over the Pandya and Chera dynasties.

Return of Cultural Heritage

  • Historians believe that the return of these copper plates is not only an event of archaeological significance, but also a major step towards reclaiming India's cultural identity and historical heritage. These inscriptions provide important information about the administrative system, religious tolerance, and international relations of the Chola period.

India Strengthens Dam Safety Framework Through Rehabilitation, Technological Upgrades and Legal Reforms

  • India is undertaking one of the world’s largest dam rehabilitation and safety modernisation programmes as the country increasingly focuses on strengthening ageing water infrastructure through policy reforms, technological interventions, legal mechanisms and institutional strengthening. 
  • The objective is to improve dam safety, operational efficiency, climate resilience and long-term sustainability of water infrastructure that supports irrigation, drinking water supply, hydropower generation, flood control and water security.

Status of Dams in India

  • India possesses the world’s third-largest dam network after the United States and China, with 6,628 specified dams across the country.
  • Nearly 98.5 percent of these dams are owned by State Governments, making states the principal stakeholders in dam management, maintenance and safety.
  • Among Indian states, Maharashtra has the highest number of specified dams, followed by Madhya Pradesh and Gujarat.
  • Dams play a critical role in India's economy and development by supporting :
    • Irrigation and agricultural productivity 
    • Hydropower generation 
    • Drinking water supply 
    • Flood moderation and management 
    • Water storage and security 
    • Industrial and urban development 

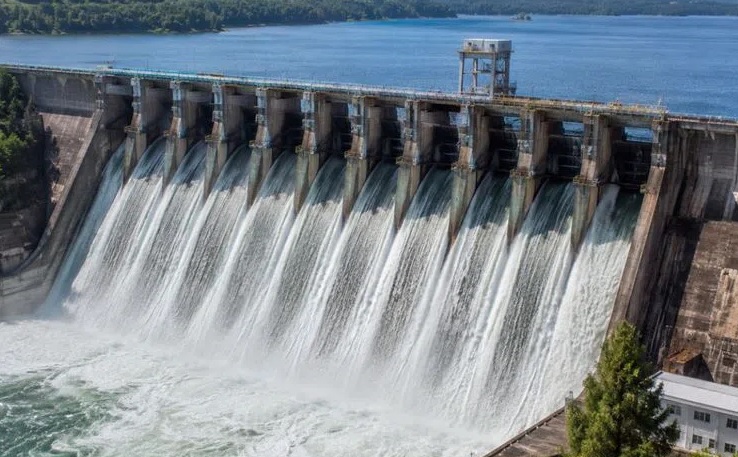
However, a significant proportion of India’s dam infrastructure is ageing rapidly.

According to the Ministry of Jal Shakti :

  • 1,681 dams, constituting around 26 percent of total specified dams, are more than 50 years old
  • 291 dams have already crossed 100 years of age
  • Around 42 percent of dams belong to the age group of 25–50 years

India’s oldest operational dam is Kallanai (Grand Anicut) located in Tamil Nadu, which has remained functional for nearly 2,000 years and continues to support irrigation activities.

Key Challenges Associated with Dam Safety in India

1. Ageing Infrastructure and Structural Deterioration

Many dams in India were constructed decades ago and are now approaching or exceeding their intended design life.

Ageing infrastructure increases :

  • Structural vulnerability 
  • Maintenance requirements 
  • Repair costs 
  • Risk of operational inefficiencies 
  • Safety concerns during extreme weather events 

The deterioration of civil structures, gates, spillways and foundations makes rehabilitation increasingly necessary.

2. Sedimentation and Reduction in Reservoir Capacity

Sedimentation has emerged as one of the most significant threats affecting reservoir performance and storage efficiency.

A study conducted by the Central Water Commission (CWC) covering 439 reservoirs found that :

  • Reservoirs have lost an average 19 percent of their gross storage capacity because of sediment deposition. 
  • Annual loss of storage capacity is estimated at approximately 0.74 percent

Reduction in storage capacity adversely affects :

  • Irrigation potential 
  • Hydropower generation 
  • Flood management capability 
  • Water availability during dry periods 

3. Seismic Vulnerability of Dams

Several dams in India are situated in earthquake-prone regions, making seismic safety an important concern.

For example, during the 2001 Bhuj Earthquake in Gujarat, liquefaction occurred in the foundation area of Chang Dam, highlighting the vulnerability of dam infrastructure to seismic events.

Earthquakes may result in :

  • Structural instability 
  • Foundation damage 
  • Cracking 
  • Increased risk of failure 

4. Climate Change and Changing Hydrological Patterns

Climate change has significantly altered hydrological conditions.

Challenges include :

  • Irregular rainfall distribution 
  • Increase in extreme precipitation events 
  • Intensification of floods and droughts 
  • Higher climate variability 
  • Increased hydrological uncertainty 

These developments require dams to be managed under more dynamic and risk-based operational systems.

5. Vulnerability to Glacial Lake Outburst Floods (GLOFs)

  • Mountainous regions face additional threats due to glacial lake expansion and sudden outburst floods.
  • In 2023, the Chungthang Dam in Sikkim was washed away during flash floods triggered by a Glacial Lake Outburst Flood (GLOF) event.
  • This incident highlighted the growing climate risks facing Himalayan infrastructure.

Dam Rehabilitation and Improvement Programme (DRIP): India’s Flagship Dam Safety Initiative

  • To address structural deficiencies and improve dam safety, the Government of India launched the Dam Rehabilitation and Improvement Project (DRIP) in 2012 with financial and technical support from the World Bank.
  • DRIP is a multi-phase programme aimed at improving :
    • Structural safety 
    • Operational performance 
    • Monitoring systems 
    • Emergency preparedness 
    • Institutional capacity 
  • Major components include :
    • Structural rehabilitation works 
    • Spillway modernisation 
    • Instrumentation systems 
    • Dam safety inspections 
    • Emergency Action Plans (EAPs) 
    • Digital monitoring mechanisms 

DRIP Phase I (2012–2021)

The first phase of DRIP was implemented between 2012 and 2021.

It covered 223 dams located across seven states, namely :

  • Jharkhand 
  • Karnataka 
  • Kerala 
  • Madhya Pradesh 
  • Odisha 
  • Tamil Nadu 
  • Uttarakhand 

Major interventions included :

  • Structural strengthening 
  • Dam safety assessments 
  • Emergency planning 
  • Capacity building of institutions 

The phase also introduced the Dam Health and Rehabilitation Monitoring Application (DHARMA).

DRIP Phase II and Phase III

The second and third phases began operations in October 2021 and substantially expanded programme coverage.

Together, they include:736 dams ,19 states ,Three central agencies 

The participating central agencies are :

  • Central Water Commission (CWC) 
  • Bhakra Beas Management Board (BBMB) 
  • Damodar Valley Corporation (DVC) 

Financial Structure of DRIP

The total financial allocation for DRIP stands at ₹10,211 crore.

Funding pattern includes :

  • ₹7,000 crore financed through external assistance from the World Bank and Asian Infrastructure Investment Bank (AIIB) 
  • ₹3,211 crore contributed by participating states and agencies 

Major dams undergoing rehabilitation include :

  • Bhakra Dam 
  • Nagarjuna Sagar Dam 
  • Gandhi Sagar Dam 

As of March 2025 :

  • Rehabilitation proposals worth ₹5,053 crore for 191 dams had received approval. 
  • Major rehabilitation works had been completed in 43 dams

Dam Safety Act, 2021: Establishing a Legal and Institutional Framework

A major milestone in dam governance was achieved with the implementation of the Dam Safety Act, 2021, which came into force in December 2021.

The Act provides a nationwide legal framework governing :

  • Surveillance 
  • Inspection 
  • Operation 
  • Maintenance 
  • Accountability mechanisms 

The objective is to prevent dam failures and improve safety standards.

A specified dam under the Act refers to :

  • Dams exceeding 15 metres in height, or 
  • Dams between 10 and 15 metres fulfilling prescribed technical conditions. 

Four-Tier Institutional Structure Under the Dam Safety Act

The Act established a comprehensive institutional framework consisting of :

  1. National Committee on Dam Safety 
  2. National Dam Safety Authority 
  3. State Committees on Dam Safety 
  4. State Dam Safety Organisations (SDSOs) 

All 31 dam-owning states have established State Dam Safety Organisations responsible for inspections, compliance and monitoring.

Key Provisions of the Dam Safety Act

The Act mandates :

  • Periodic inspections 
  • Installation of instrumentation systems 
  • Risk assessments 
  • Flood forecasting mechanisms 
  • Early warning systems 
  • Emergency Action Plans 
  • Monitoring protocols 

The law transformed dam safety from an advisory framework into a legally enforceable governance mechanism.

Technology and Digital Monitoring in Dam Safety

Technology has become the foundation of India’s evolving dam safety ecosystem.

Dam Health and Rehabilitation Monitoring Application (DHARMA)

DHARMA functions as a digital monitoring platform and now contains information related to all 6,628 specified dams.

The platform facilitates :

  • Digital inspection records 
  • Maintenance tracking 
  • Safety assessments 
  • Data management 
  • Monitoring activities 

Authorities conduct approximately 13,000 dam inspections every year, and inspection findings are digitally documented through DHARMA.

Rapid Risk Screening (RRS)

Rapid Risk Screening exercises have already been completed for 5,553 dams using web-based analytical tools.

Objectives include :

  • Identification of structural vulnerabilities 
  • Risk prioritisation 
  • Planning rehabilitation interventions 
  • Improving safety management systems 

Real-Time Monitoring and Early Warning Systems

The government is also promoting installation of :

  • Instrumentation systems 
  • Hydro-meteorological stations 
  • Early warning systems 
  • Inflow forecasting systems 

These technologies improve disaster preparedness and real-time operational monitoring.

Research Institutions and Capacity Building

India is strengthening scientific research related to dam safety.

A National Centre for Earthquake Safety of Dams is being established at Malaviya National Institute of Technology Jaipur.

Additionally, Centres of Excellence are being developed at :

  • Indian Institute of Technology Roorkee 
  • Indian Institute of Science Bengaluru 

Research areas include :

  • Seismic hazard mapping 
  • Reservoir sedimentation studies 
  • Rehabilitation technologies 
  • Risk assessment methodologies 

Mandatory Compliance Requirements for Dam Owners

The new regulatory framework imposes responsibilities on dam owners, including :

  • Central Government agencies 
  • State Governments 
  • Public sector undertakings 
  • Private entities 
  • Local authorities 

Dam owners must now :

  • Establish dedicated dam safety units 
  • Conduct pre-monsoon inspections 
  • Conduct post-monsoon inspections 
  • Allocate maintenance funds 
  • Prepare Emergency Action Plans 
  • Undertake periodic safety evaluations 

Risk-Based Categorisation Framework (2024)

From April 2024, dams are classified into three categories :

Category I : Dams having critical deficiencies requiring immediate intervention.

Category II : Dams having major deficiencies requiring corrective measures.

Category III : Dams having minor deficiencies or satisfactory conditions.

According to post-monsoon inspections conducted in 2025 :

  • Three dams were placed under Category I 
  • 188 dams were placed under Category II 

The Act also provides penalties including imprisonment and fines where negligence creates threats to life or public safety.

Shift from New Construction Towards Lifecycle Management

India’s dam policy is increasingly shifting away from constructing new infrastructure towards :

  • Lifecycle management of existing assets 
  • Rehabilitation of ageing dams 
  • Operational efficiency enhancement 
  • Climate resilience 
  • Digital governance 
  • Risk-based safety management 

The combined implementation of :

  • Dam Rehabilitation and Improvement Programme (DRIP) 
  • Dam Safety Act, 2021 
  • DHARMA digital monitoring platform 

is helping India establish a modern, technology-driven and data-based dam safety ecosystem.

These reforms are expected to reduce disaster risks while strengthening water security, agricultural sustainability, energy generation capacity and long-term resilience of critical infrastructure across the country.

INS Sagardhwani

Why in the News ?

  • Recently, the Indian Navy's oceanographic research vessel, INS Sagardhwani, departed Port Klang, Malaysia, after a successful coordination exercise with the Royal Malaysian Navy. This visit reflects the deepening maritime ties between India and Malaysia, as well as reaffirms the shared commitment of both navies to regional cooperation, knowledge sharing, and close professional ties.

About INS Sagardhwani

  • INS Sagardhwani (A74) is a state-of-the-art oceanographic research vessel of the Indian Navy.
  • It was built for the Naval Physical and Oceanographic Laboratory (NPOL), Kochi, under the Defence Research and Development Organisation (DRDO).
  • The vessel is specifically designed for oceanographic research and military strategic applications.

Key Features and Functions

  • Oceanographic Research: The ship primarily studies underwater acoustics, the marine environment, and physical, chemical, and biological oceanography.
  • Strategic Importance: Its data is extremely important for the Indian Navy, as accurate knowledge of ocean temperature, salinity, and the speed of sound helps better operate sonar systems in anti-submarine warfare (ASW).
  • Indigenous Construction: It was built by Garden Reach Shipbuilders and Engineers (GRSE), Kolkata, and commissioned into the Navy on 30 July 1994.

About the Sagar Maitri Mission

  • INS Sagar Dhwani is also known for its Sagar Maitri missions. Under the Government of India's SAGAR (Security And Growth for All in the Region) vision, the ship undertakes missions to enhance scientific cooperation with countries in the Indian Ocean Region (IOR).
  • It aims to share marine data and conduct joint research with countries such as Oman, Maldives, Sri Lanka, Thailand, Malaysia, Singapore and Indonesia.
  • ​​It strengthens India's bilateral relations with neighbouring countries and promotes maritime security.

How Scientists Are Using ‘DNA Maps’ to Expose Pangolin Trafficking Hubs

Why in News ?

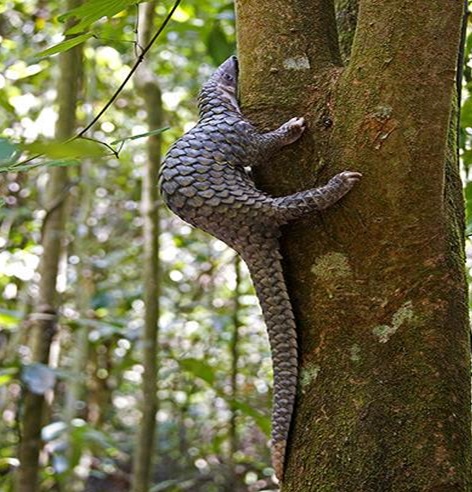
A study published in PLoS Biology on 7 May 2026 has developed an advanced DNA-based genetic mapping system (“DNA maps”) that can identify the geographic origin and trafficking routes of illegally traded pangolins, while also revealing international trafficking corridors including networks linked to northeastern India around Arunachal Pradesh and Assam feeding routes towards Yunnan in China.

How Scientists Used DNA Mapping to Trace Pangolin Trafficking

  • Pangolins are among the most trafficked mammals in the world, but conservation agencies have long faced difficulties in identifying where trafficked pangolins are originally poached because scales seized from smugglers often contain degraded DNA, making conventional genetic analysis difficult and preventing authorities from tracing seized material back to its source populations.
  • To overcome this challenge, researchers adopted a new population genomics approach in which they focused only on 671 specific locations of the pangolin genome that differ between populations and can therefore act as geographic markers for identifying the origin of trafficked animals.
  • The researchers also used 122 museum specimens to fill historical and geographical gaps from regions where pangolins have become rare or locally extinct, and combined these with hundreds of modern samples to create an extensive geo-referenced genetic database covering the distribution of all eight pangolin species.
  • This resulted in the creation of an unprecedented “genetic map”, which can now help state agencies and wildlife authorities accurately determine the source location of seized pangolins and their body parts.

Major Findings of the Study

The study challenged the traditional assumption that domestic pangolin trade and international trafficking operate independently, revealing instead that the same source areas frequently supply both local markets and international smuggling networks.

Researchers found that pangolins involved in domestic trade are transported an average distance of around 454 km from their original habitat, indicating the existence of organised local supply chains before the animals enter international trafficking routes.

The study further identified three major international trafficking hotspots:

Species

Major Trafficking Hub

White-bellied Pangolin

Southwestern Cameroon

Sunda Pangolin

Southwestern Borneo

Chinese Pangolin

Myanmar region

Researchers also observed that traffickers often collect scales from multiple nearby pangolin populations and consolidate them before exporting them internationally, mainly towards consumer markets in China and Vietnam.

India-linked Pangolin Trafficking Network

  • The research identified evidence suggesting that northeastern India, particularly areas around Arunachal Pradesh and Assam and possibly Bhutan, may be contributing to trafficking routes supplying Yunnan Province in China, while Yunnan itself may further serve as a source region for Guangdong, indicating the existence of interconnected regional wildlife trafficking corridors across Asia.
  • This finding is particularly significant because it highlights India’s importance not only as a habitat region for pangolins but also as a potential transit and supply zone within broader transnational wildlife trade networks.

Importance of the DNA-Based Genetic Map

  • The newly developed genetic database may significantly strengthen wildlife conservation and law enforcement efforts because it enables authorities to identify poaching hotspots, trace confiscated wildlife products back to their source populations, provide scientific evidence for prosecution, improve anti-trafficking operations, and disrupt illegal supply chains at their origin rather than only intercepting shipments after trafficking has occurred.
  • Considering that global authorities recorded more than 1.4 lakh wildlife seizures between 2015 and 2021, this technology may provide the missing evidence needed to target illegal wildlife trade networks effectively.

About Pangolins

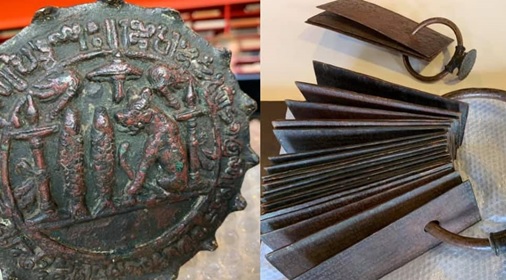
The pangolin is one of the world's most unique and mysterious creatures. It is the only mammal with hard scales made of keratin—the same keratin that makes up our nails and hair.

Physical Features and Behavior

  • Unique protective armor: When threatened, the pangolin curls up like a ball. Its armor is so strong that even a lion or leopard cannot chew it.
  • Diet: It has no teeth. It feeds on ants and insects with its long, sticky tongue. An adult pangolin can consume approximately 70 million insects a year, which is why it is also known as a "natural pest controller."
  • Temperament: It is a shy and nocturnal creature that prefers to live alone.

Species Diversity

  • There are eight species of pangolins globally, of which four species occur in Africa and four species occur in Asia.

African Pangolin Species

  • White-bellied Pangolin 
  • Black-bellied Pangolin 
  • Giant Ground Pangolin 
  • Temminck’s Ground Pangolin 

Asian Pangolin Species

  • Indian Pangolin 
  • Chinese Pangolin 
  • Sunda Pangolin 
  • Philippine Pangolin 

Habitat and Distribution

  • Pangolins inhabit tropical forests, grasslands, agricultural landscapes and areas close to human settlements, while the Indian pangolin is widely distributed across India, Nepal, Sri Lanka and Bangladesh.
  • The species plays an important ecological role because it feeds primarily on ants and termites, thereby helping in natural pest control, soil aeration and maintenance of ecosystem balance.

Threats Faced by Pangolins

  • Pangolins face severe threats due to illegal wildlife trade, habitat destruction and increasing human activities, while their scales continue to be used in traditional medicine systems in parts of Asia and their meat is consumed as a delicacy in some regions.
  • Simultaneously, deforestation, agricultural expansion, infrastructure development and habitat fragmentation have accelerated population decline across their distribution range.

Conservation Status

  • The Indian Pangolin is listed as Endangered on the IUCN Red List, whereas the Chinese Pangolin is categorised as Critically Endangered due to rapid population decline.
  • In India, both species receive the highest level of legal protection under Schedule I of the Wildlife (Protection) Act, 1972.
  • At the international level, all eight pangolin species are included in Appendix I of CITES, which prohibits international commercial trade in these species.
« »
  • SUN
  • MON
  • TUE
  • WED
  • THU
  • FRI
  • SAT
Have any Query?

Our support team will be happy to assist you!

OR