Prelims: (Economy + CA)
Mains: (GS 2 - Welfare Schemes, Government Policies; GS 3 – Economy) |
Why in News ?
The World Inequality Report 2026, released by the World Inequality Lab (led by economists Thomas Piketty, Lucas Chancel, Emmanuel Saez & Gabriel Zucman), highlights widening income, wealth, gender, and climate inequalities across India and the world. It is the 3rd major edition after 2018 and 2022, and its findings are crucial for debates on inclusive growth, SDGs, climate equity, redistribution policies, and welfare economics.
Background & Context
Global inequality has intensified since the 1980s with rising wealth concentration, stagnant wages, weak social protection systems, and the rise of billionaire capital.
In India, liberalisation accelerated economic growth but also deepened disparities due to unequal access to education, health, employment, digital technology, and assets.
The 2026 report comes amid:
- Slow post-pandemic recovery
- Concentration of global capital among ultra-rich groups
- Rising climate vulnerability
- Weak multilateralism
- Declining female labour participation in many developing economies
The report argues that inequality is not inevitable, but a policy choice driven by taxation structures, labour market design, and redistribution frameworks.
India’s Income and Wealth Inequality
Average Levels
- Average annual income: ~€6,200 (PPP)
- Average wealth: ~€28,000 (PPP)
Income Inequality
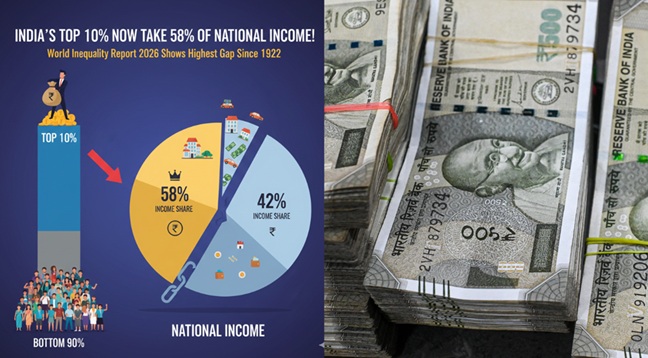
- Top 10% earn 58% of national income.
- Bottom 50% receive only 15%.
- Gap increased from 2022 (Top 10%: 57%; Bottom 50%: 13%).
Wealth Inequality
- Top 10% own 65% of total wealth.
- Top 1% hold 40% of India’s wealth — among the highest globally.
Global Inequality Trends
- Top 0.001% (~60,000 ultra-rich) own 3× more wealth than the bottom 50% of humanity.
- Global top 10% own 75% of world wealth;
- Bottom 50% hold just 2%.
- Top 1% control 37% of global wealth — more than 18× the bottom 50%.
Geographic Inequality Shift (1980–2025)
China – Upward Shift
- Majority population has moved into global middle-income segments.
India – Relative Decline
- In 1980: More Indians were in the global middle 40%.
- Today: Most fall in the bottom 50%.
Sub-Saharan Africa
- Still concentrated overwhelmingly in the global bottom half.
Gender Inequality
India
- Female Labour Force Participation Rate (FLFPR): 15.7%
- Persistent wage gaps across sectors.
Global Trends
- Women earn 61% of men’s wages (excluding unpaid care).
- Including unpaid work → women’s earnings fall to 32%.
- Women’s share of global labour income: 25% (unchanged since 1990).
Regional Shares of Women’s Labour Income
- MENA: 16%
- South & Southeast Asia: 20%
- Sub-Saharan Africa: 28%
- East Asia: 34%
- Europe/North America: ~40%
Climate Inequality
- Bottom 50% of population contributes only 3% of emissions.
- Top 10% contribute 77% of emissions.
- Top 1% alone account for 41% of emissions linked to private capital ownership — more than the entire bottom 90%.
Reasons Behind Worsening Inequality
- Rising ultra-wealth concentration
- Weak progressive taxation
- Low female labour participation
- Erosion of global multilateral frameworks
- Expansion of informal employment
- Unequal access to health, education, tech and financial services
- Climate impact burden on poorest regions
- Digital divide and unequal asset ownership
Challenges Identified & Policy Recommendations
1. Regressive Taxation
- Effective tax rates fall sharply for billionaires → loss of state revenue.
- Recommendations
- Introduce wealth & inheritance taxes
- Remove tax loopholes for ultra-rich
- Strengthen tax compliance
2. Gendered Inequalities
- Unpaid domestic work limits women's economic mobility.
- Recommendations
- Public investment in childcare
- Skill development for women
- Reduce unpaid care burden
- Encourage flexible, safe employment
3. Inter-country Inequality
- India lagging behind China in shifting population to the middle class.
- Recommendations
- Expand social protection (cash transfers, pensions, unemployment insurance)
- Increase rural incomes and urban mobility
4. Climate Responsibility Gap
- High-emission groups escape accountability.
- Recommendations
-
- Climate justice framework
- Green taxation on high emitters
- Incentivize renewable energy
5. Inequality Within the Top
- Extreme income concentration even among high earners.
- Recommendations
- Larger public investment in human capital:
- Universal high-quality education
- Healthcare
- Childcare
- Nutrition
- Reduce early-life disparity
FAQs
1. What is the World Inequality Report ?
It is a global assessment of income, wealth, gender, and climate inequalities, prepared by the World Inequality Lab using tax data, national accounts, and survey datasets.
2. Why is the 2026 report significant for India ?
Because it shows India’s rising concentration of wealth among the top 1% and a relative decline in its share of the global middle class.
3. Who prepares the report ?
The World Inequality Lab, led by economists Thomas Piketty, Emmanuel Saez, Lucas Chancel, and Gabriel Zucman.
4. How unequal is India according to the report ?
- Top 10% earn 58% of income.
- Bottom 50% earn only 15%.
- Top 1% own 40% of wealth.
5. How is climate inequality measured ?
By analysing emissions linked to private capital ownership. Top 1% account for 41% of these emissions.
|


 Contact Us
  New Batch : 9555124124/ 7428085757
  Tech Support : 9555124124/ 7428085757