New
GS Foundation (P+M) - Delhi : 05th Jan., 2026 Winter Sale offer UPTO 75% + 10% Off GS Foundation (P+M) - Prayagraj : 15th Dec., 11:00 AM Winter Sale offer UPTO 75% + 10% Off GS Foundation (P+M) - Delhi : 05th Jan., 2026 GS Foundation (P+M) - Prayagraj : 15th Dec., 11:00 AM

India’s 8.2% Growth: Strengths & Fault Lines

Prelims: (Economy + CA)
Mains: (GS 3 – Economy)

Why in News?

India recorded a strong 8.2% GDP growth, supported by robust manufacturing and services performance. However, the IMF graded India’s national income accounting system as ‘Grade C’, pointing to statistical limitations and structural data gaps.

Background & Context

  • India is currently among the fastest-growing major economies, outpacing global growth expectations.
  • The growth is taking place amid global economic uncertainties—weak global demand, geopolitical tensions, and tightening international financial conditions.
  • The IMF’s assessment has reopened a key debate: Is strong economic growth sustainable without strengthening India’s statistical and institutional framework ?

Current Growth Performance

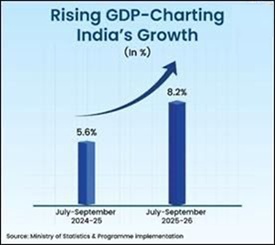
India’s GDP for the quarter rose to ₹48.63 lakh crore, surpassing last year’s output and showing sustained recovery beyond post-COVID normalisation.

Sector-wise Performance

  • Manufacturing: 9.1% — improved industrial demand and rising capacity utilisation.
  • Services:9.2% — now 60% of GDP; financial services witnessed 10.2% growth.
  • Agriculture: 3.5% — helped by better reservoir levels and horticulture output.

Additional Growth Indicators

  • Real GVA: ₹82.88 lakh crore → ₹89.41 lakh crore — indicating genuine value addition.
  • Nominal GDP: up 8.8%, reflecting subdued inflation.
  • Private consumption:7.9%, signalling strong household demand.

Macroeconomic Stability Indicators

India’s macroeconomic fundamentals remain stable:

  • Inflation eased and remained close to the RBI’s target band.
  • Bank credit grew steadily, supported by well-capitalised banks.
  • Fiscal consolidation progressed: GST collections and direct tax revenues continued to perform strongly.
  • Current account deficit remained modest—supported by strong services exports and stable forex reserves.

These indicators reinforce India’s economic resilience.

IMF’s Grade C Assessment: Implications

The IMF’s ‘Grade C’ rating reflects deficiencies in India’s statistical system, not its growth performance.

Key Concerns Highlighted by IMF

  • Use of an outdated 2011–12 base year.
  • Overreliance on WPI, absence of a comprehensive Producer Price Index (PPI).
  • Single deflation method creating cyclical distortions.
  • Mismatch between production and expenditure GDP estimates.
  • Gaps in representing the informal sector.
  • Absence of seasonally adjusted data.
  • Lack of consolidated state and local government finances since 2019.

The IMF notes that India requires a stronger statistical backbone to match its economic scale.

Uneven Recovery Across Sectors

Growth is strong but not evenly distributed.

  • Mining: barely grew (0.04%) — due to extended monsoon disruptions.
  • Electricity, gas & utilities: 4.4%, limited by a milder winter reducing energy demand.

Sectoral Composition of GVA

  • Primary sector: 14%
  • Secondary sector: 26%
  • Tertiary sector: 60%

Despite a high-services share, India’s workforce remains concentrated in low-productivity agriculture and informal services—reflecting a structural imbalance.

Structural Vulnerabilities

1. Weak Export Competitiveness

  • Slow scaling of high-value manufacturing
  • Global geopolitical uncertainties
  • Frequent tariff changes impacting investor confidence

2. Low Labour Productivity

  • Majority of labour still in low-productivity sectors
  • Slow pace of formalisation despite rapid digital growth

3. Weak Institutional and Statistical Capacity

  • Outdated base year
  • Incomplete data representation
  • Lack of uniform data from States and local bodies

4. Persistent External Pressures

  • Rupee faces downward pressure due to a strong USD
  • Volatile foreign capital flows
  • Structural current account pressures

These vulnerabilities do not undermine India’s 8.2% growth but highlight the reforms needed to sustain long-term economic momentum.

FAQs

1. Does the IMF’s Grade C mean India’s GDP numbers are unreliable ?

No. It reflects weaknesses in data systems, not the GDP growth outcome. It calls for modernising India’s statistical framework.

2. Why is India’s GDP growth so strong despite global slowdown ?

Strong domestic demand, resilient manufacturing, expansion in services, and controlled inflation have supported growth.

3. Why is the base year 2011–12 considered outdated ?

It no longer captures current consumption patterns, production structures, digital activity, and post-pandemic economic shifts.

4. What sectors contributed most to the 8.2% growth ?

Manufacturing (9.1%) and services (9.2%), particularly financial services.

5. What does low mining and utilities growth indicate ?

It signals uneven recovery and weak performance in key input sectors that drive industrial activity.

« »
  • SUN
  • MON
  • TUE
  • WED
  • THU
  • FRI
  • SAT
Have any Query?

Our support team will be happy to assist you!

OR