New
GS Foundation (P+M) - Delhi : 19th Jan. 2026, 11:30 AM Spring Sale UPTO 75% + 10% Off, Valid Till : 6th Feb., 2026 GS Foundation (P+M) - Prayagraj : 09th Jan. 2026, 11:00 AM Spring Sale UPTO 75% + 10% Off, Valid Till : 6th Feb., 2026 GS Foundation (P+M) - Delhi : 19th Jan. 2026, 11:30 AM GS Foundation (P+M) - Prayagraj : 09th Jan. 2026, 11:00 AM

Current Affairs for 29 January 2026

Fishing Harbour Project

Context

  • Recently, the Department of Fisheries, Ministry of Fisheries, Animal Husbandry and Dairying, Government of India, approved the proposal for the development of a Smart and Integrated Fishing Harbour at Mayabunder in the Andaman and Nicobar Islands.
  • The project will be implemented at an estimated cost of approximately ₹199.24 crore with 100% central financial assistance under the Pradhan Mantri Matsya Sampada Yojana (PMMSY).

About the Smart and Integrated Fishing Harbour Project

  • This Smart Fishing Harbour will be developed in line with the Blue Port initiative, providing safe landing and berthing facilities equipped with the latest technologies and IoT-enabled systems.
  • The project aims to promote sustainable fisheries management, increase fish handling capacity, and strengthen operational safety.
  • Additionally, it will incorporate energy-efficient systems, digital traceability, and environmentally friendly processes. This will not only increase efficiency in the fisheries sector but also help control illegal, unreported, and unregulated (IUU) fishing.
  • This initiative will help India progress towards the Sustainable Development Goals (SDGs).

Boosting Employment and the Fisheries Value Chain

  • The development of a smart and integrated fishing harbor will provide safe landing and berthing facilities for approximately 430 fishing vessels.
  • This will ensure the landing of approximately 9,900 tons of fish per year.
  • This project is expected to create new employment opportunities in the fisheries value chain and strengthen the income and livelihoods of the fishing community.

Fisheries Potential of the Andaman and Nicobar Islands

  • The Andaman and Nicobar Islands have an Exclusive Economic Zone (EEZ) of approximately 600,000 square kilometers, which offers vast marine resources.
  • It is estimated that the island has a stock of 60,000 metric tons of tuna and tuna-like species, including approximately 24,000 metric tons of yellowfin tuna and 2,000 metric tons of skipjack tuna.

Investment and Value Chain Development Efforts

  • To encourage investment in the fisheries sector and develop the value chain, the Fisheries Department organized an investor conference on "Investment Opportunities in the Fisheries and Aquaculture Sector of the Andaman and Nicobar Islands" on November 14, 2024, at Swaraj Dweep.
  • Investors with expertise in tuna fishing technologies, seaweed production, and related infrastructure participated in the conference. Additionally, a tuna cluster has been notified in the islands under the PMMSY, aimed at strengthening infrastructure development, training, investor partnerships, and global competitiveness.

PMMSY in the Andaman and Nicobar Islands Strengthening the Fisheries Sector

  • Fisheries infrastructure and livelihood support systems have been significantly strengthened in the Andaman and Nicobar Islands under the Pradhan Mantri Matsya Sampada Yojana (PMMSY).
  • An investment of approximately ₹5,573.02 lakh has been made so far, enabling the development of a holistic and integrated fisheries ecosystem from production to marketing.
  • These efforts have equally strengthened fish production, post-harvest management, value addition, transportation, and fishermen's welfare.

Expansion of Infrastructure and Production Capacity

  • Assistance provided under the PMMSY has led to significant progress in various sectors of fisheries, including hatchery development, open sea cage farming, ornamental fisheries, value-added enterprises, cold-chain logistics, fish transportation, and community support systems.
  • The major achievements of the scheme include the establishment of five freshwater finfish hatcheries, seven small-scale ornamental fish farming units, new brackishwater ponds covering an area of ​​23.2 hectares, and freshwater ponds covering an area of ​​17.9 hectares.
  • Additionally, fish feed production units, insulated vehicles, refrigerated transportation systems, fish kiosks, and bio-toilets for mechanized fishing vessels have also been established.

Fishermen Welfare and Livelihood Support

  • Livelihood and nutritional support has been provided to 1,000 traditional fishing families.
  • 280 Sagar Mitras have been deployed under the IT-enabled service delivery system, improving communication and access to services between the fishing community and the administration.
  • The cold chain has been modernized and expanded through new and upgraded cold-chain facilities with a capacity of 10–20 tonnes, which have helped maintain the quality of fish products and reduce wastage.

Improving the Value Chain, Safety, and Traceability

  • PMMSY initiatives have strengthened the entire value chain from production to market through ice plants, cold storage, insulated vehicles, e-rickshaws equipped with ice boxes, and fish value addition units.
  • Additionally, the installation of 300 communication and tracking devices on fishing vessels has significantly improved maritime safety and monitoring capabilities.

Progress of India's Fisheries Sector

  • India's fisheries sector has witnessed remarkable progress in recent years. Public investment of over ₹39,000 crore has laid a strong foundation in production, infrastructure, technology, fisher welfare, and value addition. As a result, fish production is projected to increase from 9.6 million tonnes in 2013–14 to approximately 19.775 million tonnes in 2024–25.
  • Similarly, seafood exports have also doubled in value to ₹62,408 crore, with over 350 products being exported to approximately 130 countries.

UGC Tightens Campus Equity Norms to Tackle Discrimination, Sparks Debate

Prelims: (Polity & Governance + CA)
Mains: (GS 2 – Social Justice, Education, Governance)

Why in News ?

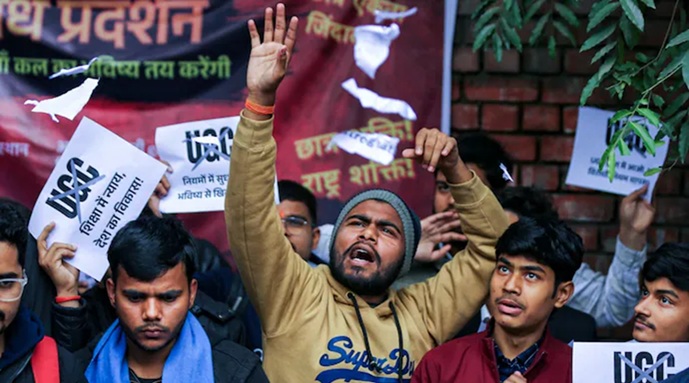
The University Grants Commission (UGC) has notified new regulations to curb discrimination, including caste-based bias, in higher education institutions. The move follows Supreme Court intervention after petitions by the mothers of Rohith Vemula (2016) and Payal Tadvi (2019), who died by suicide amid allegations of caste-based discrimination.

While these rules update the earlier 2012 equity regulations, they have also triggered pushback, with critics arguing that some provisions may lead to harassment of general category students.

UGC Notifies Promotion of Equity Regulations, 2026

The UGC has notified the University Grants Commission (Promotion of Equity in Higher Education Institutions) Regulations, 2026.

The regulations aim to eradicate discrimination in higher education on grounds such as religion, race, gender, place of birth, caste, or disability, with a special focus on:

  • Scheduled Castes (SCs)
  • Scheduled Tribes (STs)
  • Other Backward Classes (OBCs)
  • Economically Weaker Sections (EWS)
  • Persons with Disabilities (PwDs)

These rules replace the 2012 Promotion of Equity Regulations and apply to all higher education institutions. They establish a formal structure and time-bound procedure for filing and redressing discrimination-related complaints on campuses.

How Will the New UGC Regulations Be Implemented ?

To operationalise the regulations, the UGC has mandated a three-tier institutional mechanism in every higher education institution:

1. Equal Opportunity Centre (EOC)

  • Every institution must establish an EOC to oversee policies for disadvantaged groups.
  • It will coordinate with the district administration and police and facilitate legal aid where required.
  • The EOC will consist of five faculty members, with no category-wise reservation mandated.
  • If a college does not have five faculty members, the university-level EOC of the affiliating university will perform these functions.

2. Equity Committee

  • A 10-member committee, chaired by the head of the institution, will support the EOC.
  • Five members must belong to reserved categories—OBCs, SCs, STs, PwDs, and women.
  • The committee must:
    • Meet within 24 hours of receiving a complaint
    • Submit its report within 15 days
  • The head of the institution must initiate action within seven days of receiving the report.

3. Equity Squads and Helpline

  • Institutions must constitute Equity Squads to remain vigilant and prevent discrimination on campus.
  • Squads are required to be mobile and regularly visit vulnerable or sensitive locations.
  • A 24-hour Equity Helpline must be established.
  • Institutions must also appoint Equity Ambassadors to promote awareness and act as “torch bearers” of equity and inclusion.

How Do the 2026 UGC Regulations Differ from the 2012 Rules ?

Nature of the Regulations

  • 2012: Largely advisory, stating that punishment should be proportionate to the discrimination or harassment, without clearly defined enforcement mechanisms.
  • 2026: Mandatory and enforceable, with clearly specified structures, procedures, and penalties for non-compliance.

Enforcement and Penalties

  • 2012: No provision for action against institutions failing to comply.
  • 2026: Empowers the UGC to monitor implementation through a national-level monitoring committee and take punitive action, including:
    • Debarring institutions from UGC schemes
    • Restricting them from offering degree or online programmes
    • Removing eligibility for central grants

Institutional Mechanisms

  • 2012: Provided for Equal Opportunity Cells and an Anti-Discrimination Officer, but without detailed composition or procedures.
  • 2026: Introduces a multi-tier system—EOCs, Equity Committees, and Equity Squads—with clearly defined roles, composition, and accountability.

Complaint Handling and Procedures

  • 2012: Lacked clarity on complaint registration, timelines, and disposal.
  • 2026: Lays down elaborate, time-bound procedures for filing, examining, and resolving complaints at every stage.

Coverage of Social Groups

  • 2012: Focused mainly on SCs and STs, with no explicit mention of OBCs.
  • 2026: Explicitly covers OBCs, SCs, STs, PwDs, women, and other disadvantaged groups, reflecting a more inclusive and comprehensive approach.

Controversy Over the New UGC Regulations

The new rules have attracted criticism from some student groups and commentators, who argue that:

  • The regulations could lead to harassment of general category students.
  • The absence of penalties for false complaints may result in misuse of the framework.
  • Institutions could face punitive action even in cases of disputed or unproven allegations.
  • The rules may entrench caste identities on campuses rather than reduce them, and could be politically motivated, especially with regard to OBC categorisation.

Supporters, however, argue that the regulations are necessary to ensure institutional accountability, protect vulnerable students, and prevent tragedies like those of Rohith Vemula and Payal Tadvi.

Significance for Higher Education Governance

The 2026 regulations mark a shift from advisory equity norms to a rights-based, enforceable framework in higher education. They aim to:

  • Institutionalise equity and inclusion
  • Ensure time-bound redressal of discrimination complaints
  • Strengthen accountability of institutions
  • Align campus governance with constitutional values of equality, dignity, and social justice

FAQs

1. What are the UGC Promotion of Equity Regulations, 2026 ?

They are new, enforceable rules notified by the UGC to prevent discrimination in higher education institutions and ensure equity, inclusion, and accountability.

2. Why were these regulations introduced ?

They followed Supreme Court intervention after cases of alleged caste-based discrimination, including the deaths of Rohith Vemula and Payal Tadvi, highlighting gaps in the earlier framework.

3. What new institutional mechanisms do the 2026 regulations introduce ?

They mandate Equal Opportunity Centres, Equity Committees, Equity Squads, a 24-hour helpline, and Equity Ambassadors in all institutions.

4. How are the 2026 regulations different from the 2012 rules ?

Unlike the largely advisory 2012 rules, the 2026 regulations are mandatory, time-bound, and enforceable, with penalties for institutional non-compliance and broader social group coverage.

5. What are the main criticisms of the new regulations ?

Critics argue that the absence of penalties for false complaints may lead to misuse, harassment of general category students, and increased caste-based divisions on campuses.

Model Youth Gram Sabha: Nurturing Democratic Participation Among School Students

Prelims: (Polity & Governance + CA)
Mains: (GS 2 – Decentralisation, Local Governance, Youth Engagement)

Why in News ?

The Ministry of Panchayati Raj, in collaboration with the Ministry of Education and the Ministry of Tribal Affairs, is jointly organising a National Award Ceremony to felicitate the winners of the Model Youth Gram Sabha initiative.

Model Youth Gram Sabha: Concept and Objectives

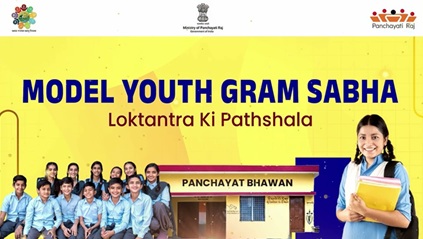
The Model Youth Gram Sabha is a simulated forum that enables school students to participate in mock Gram Sabha sessions, closely replicating the functioning of real village assemblies.

Inspired by the Model United Nations (Model UN) framework, this initiative aims to:

  • Strengthen Janbhagidari (people’s participation)
  • Promote participatory local governance
  • Build awareness about grassroots democracy among students
  • Foster civic responsibility and leadership skills at an early age

It is a flagship initiative of the Ministry of Panchayati Raj, implemented in collaboration with the Ministry of Education and the Ministry of Tribal Affairs.

Institutional Framework and Implementation

  • Lead Ministry: Ministry of Panchayati Raj
  • Collaborating Ministries: Ministry of Education and Ministry of Tribal Affairs
  • Coverage: Rolled out across schools nationwide, including:
    • Jawahar Navodaya Vidyalayas
    • Eklavya Model Residential Schools (EMRSs)
    • State Government Schools
  • Recognition: Outstanding schools and student participants are honoured at a National Award Ceremony, reinforcing the importance of civic engagement.

Key Features of the Model Youth Gram Sabha

1. Role-Based Simulation

  • Students from Classes 9–12 assume roles such as:
    • Sarpanch
    • Ward members
    • Village secretary
    • Anganwadi worker and other village-level officials

2. Mock Gram Sabha Proceedings

  • Students conduct mock Gram Sabha meetings.
  • They deliberate on:
    • Local development issues
    • Social welfare challenges
    • Public service delivery
  • They prepare:
    • Village budgets
    • Development plans, mirroring real Panchayat processes.

3. Financial Support

  • The Ministry of Panchayati Raj provides ₹20,000 per school to support the organisation of mock Gram Sabha sessions, ensuring logistical and material readiness.

Significance for Participatory Governance

  • Civic Education: Builds foundational knowledge of constitutional values, Panchayati Raj institutions, and democratic processes.
  • Youth Empowerment: Encourages leadership, public speaking, negotiation, and problem-solving skills.
  • Democratic Deepening: Promotes early engagement with grassroots democracy, strengthening the long-term culture of participation.
  • Inclusivity: Special emphasis on schools serving tribal and rural populations enhances equitable civic exposure.
  • Governance Innovation: Introduces experiential learning into civic education, bridging theory and practice.

Challenges and Way Forward

  • Uniform Implementation: Ensuring consistency and quality across diverse school systems and regions.
  • Teacher Training: Capacity building of educators to effectively guide simulations.
  • Sustainability: Integrating the initiative into school curricula and annual academic calendars for long-term impact.
  • Monitoring and Evaluation: Developing robust frameworks to assess learning outcomes and civic engagement levels.
  • Scaling Best Practices: Sharing successful models and innovations across states and school networks.

FAQs

1. What is the Model Youth Gram Sabha ?

It is a simulated platform where school students participate in mock Gram Sabha sessions to learn about grassroots governance and democratic processes.

2. Which ministries are implementing this initiative ?

The Ministry of Panchayati Raj, in collaboration with the Ministry of Education and the Ministry of Tribal Affairs.

3. Who can participate in the Model Youth Gram Sabha ?

Students from Classes 9 to 12 in schools across India, including JNVs, EMRSs, and state government schools.

4. What activities do students perform during the mock sessions ?

They play roles such as sarpanch and ward members, conduct meetings, discuss village issues, and prepare budgets and development plans.

5. What financial support is provided to schools ?

Each participating school receives ₹20,000 from the Ministry of Panchayati Raj to organise the mock Gram Sabha sessions. 

India–EU Free Trade Pact: A Landmark in a Fragmenting Global Trade Landscape

Prelims: (International Relations + CA)
Mains: (GS 2 – International Relations; GS 3 – Economy, Trade, Globalisation)

Why in News ?

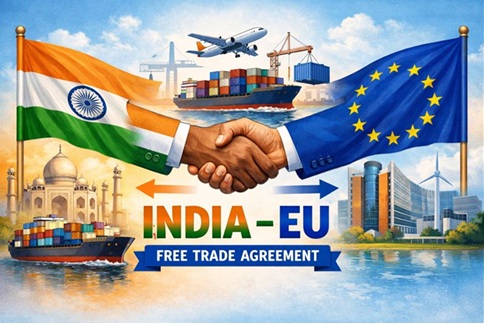
At the India–EU Leaders’ Summit, Prime Minister of India, European Council President António Luís Santos da Costa, and European Commission President Ursula von der Leyen announced the successful conclusion of negotiations of the India–EU Free Trade Agreement (FTA).

The agreement marks a major breakthrough in the India–EU Strategic Partnership, especially at a time marked by global trade uncertainty, tariff wars, de-risking strategies, and supply chain disruptions.

Significance of the India–EU FTA

  • Scale and global weight: India and the EU together account for around 25% of global GDP and over one-third of global trade, making this one of the world’s most consequential bilateral trade agreements.
  • Trade partnership depth: The EU is India’s second-largest export destination after the United States.
  • Strategic complementarity: The agreement complements India’s recent FTAs with the United Kingdom and the European Free Trade Association (EFTA), strengthening India’s trade diversification strategy.
  • Geopolitical relevance: Concluded amid rising protectionism, fragmentation of supply chains, and great-power competition, the FTA signals a shared commitment to open, rules-based, and multilateral trade.

Key Components and Takeaways of the Agreement

1. Trusted Strategic Partnership

  • Anchored in shared democratic values, rule of law, and human rights.
  • Strengthened by people-to-people ties, including:
  • Around 1.7 million Indian diaspora in the EU.
  • Over 1.21 lakh Indian students enrolled in EU universities.
  • Enhances India’s soft power diplomacy and long-term strategic trust.

2. Economic Complementarity, Scale, and Diversity

  • India (world’s 4th-largest economy) and the EU (world’s 2nd-largest economy) are complementary rather than competitive.
  • Market integration opens unprecedented opportunities in:
    • Manufacturing
    • Services
    • Investment
    • Technology cooperation.

3. Trade Diversification, Supply Chain Resilience, and De-Risking

  • Reduces excessive dependence on China-centric supply chains.
  • Strengthens resilience amid:
    • US–China trade tensions
    • Weaponisation of trade and technology
    • Geopolitical disruptions to logistics and production networks.

4. Commercially Meaningful “Win–Win” Deal

  • For India:
    • Major tariff gains in labour-intensive sectors such as:
      • Textiles and clothing
      • Gems and jewellery
      • Leather and footwear
    • These sectors previously faced high EU tariffs, making the FTA economically transformative.
  • For the EU:
    • Improved access to a large, fast-growing Indian market with relatively higher tariffs.
    • Provides EU firms a competitive edge over countries without an India–EU FTA.

5. Safeguarding Sensitive Agriculture and Food Security

  • Core agricultural sectors such as dairy, cereals, meat, and select fruits and vegetables are excluded.
  • Addresses concerns of Indian farmers, a key political and electoral constituency.
  • Ensures food security and rural livelihood protection while opening other sectors.

6. Calibrated Opening of the Automobile Sector

  • EU automakers granted access mainly in higher price segments.
  • Encourages:
    • Make in India
    • Technology transfer
  • Future exports from India.
  • Consumers benefit from:
    • Better technology
    • Increased competition
    • Higher safety and environmental standards.

7. Carbon Border Adjustment Mechanism (CBAM) and Green Protectionism

  • Despite CBAM being a sensitive and complex EU regulation, the FTA provides:
    • Most-favoured treatment
    • A dedicated technical dialogue mechanism
    • EU support for India’s green and climate transition.
  • Enables India to safeguard competitiveness while aligning with climate commitments.

8. Services as the Future Growth Driver

  • Services expected to dominate future bilateral trade growth.
  • Key gains for India include:
    • Certainty of market access
    • Non-discriminatory treatment
    • Boost to digitally delivered services
    • Easier mobility of professionals
    • Coordination on social security
    • Greater penetration of Indian talent and students in the EU.

9. A “Living Agreement” with Review Mechanisms

  • Designed as a dynamic, evolving framework.
  • Includes:
    • Periodic review clauses
    • Consultation mechanisms for emerging technologies and regulations.
  • Relies on mutual trust and strong institutional stewardship for long-term relevance.

10. Signal to Global Business and the United States

  • Projects India as a reliable supporter of open, fair, stable, and rule-based trade.
  • Sends a strong message amid:
    • Tariff wars
    • Unilateral trade actions
    • Rising protectionism, including from major economies such as the US.
  • Reinforces India’s commitment to multilateralism and trade certainty.

Challenges and Way Forward

  • Managing adjustment costs:
    • Particularly in sensitive domestic sectors.
    • Requires targeted support, skilling, and industrial upgrading.
  • Aligning regulatory standards and compliance mechanisms:
    • Effective implementation will need capacity-building support for regulators and businesses.
  • Addressing CBAM-related competitiveness concerns:
    • Use review mechanisms to adapt to technological change and climate transition pathways.
  • Ensuring gains for MSMEs and small farmers:
    • Strengthening domestic competitiveness through structural reforms, credit access, and export facilitation.

FAQs

1. Why is the India–EU FTA considered strategically important ?

Because India and the EU together account for about 25% of global GDP and over one-third of global trade, making this agreement globally consequential.

2. Which sectors benefit the most from the FTA ?

India gains significantly in labour-intensive sectors such as textiles, gems and jewellery, leather, and footwear, while the EU gains access to India’s large and fast-growing market.

3. How does the FTA address climate and sustainability concerns ?

It includes provisions on the EU’s Carbon Border Adjustment Mechanism (CBAM), technical dialogue, and EU support for India’s climate transition.

4. What does a “living agreement” mean in this context ?

It means the FTA includes review clauses and consultation mechanisms to adapt to emerging technologies, regulations, and evolving global conditions.

5. How does the FTA strengthen India’s global economic position ?

It enhances trade diversification, supply chain resilience, services exports, and India’s role as a supporter of open, rule-based global trade.

onomic Survey 2025–26: Sustaining High Growth Amid Global Fragmentation

Prelims: (Economy + CA)
Mains: (GS 3 – Indian Economy, Fiscal Policy, Infrastructure, Inclusive Growth)

Why in News ?

The Union Minister for Finance and Corporate Affairs, Smt. Nirmala Sitharaman, tabled the Economic Survey 2025–26 in Parliament on 29 January 2026. The Survey presents a comprehensive assessment of India’s macroeconomic performance, sectoral trends, structural reforms, and future outlook.

State of the Economy: Growth with Resilience

  • Growth Projections:
    • First Advance Estimates project real GDP growth at 7.4% and GVA growth at 7.3% in FY26.
    • Potential growth for India is estimated at around 7%, while FY27 growth is projected at 6.8–7.2%.
  • Demand-Side Trends:
    • Private Final Consumption Expenditure (PFCE) grew by 7.0% in FY26, reaching 61.5% of GDP, the highest since 2012.
    • Growth supported by low inflation, stable employment, and rising real purchasing power.
    • Strong agricultural performance boosted rural demand, while urban consumption improved due to tax rationalisation.
  • Investment Activity:
    • Gross Fixed Capital Formation (GFCF) grew by 7.8% and remained at 30% of GDP, driven by public capex and revival in private investment.
  • Supply-Side Performance:
    • Services sector remains the main growth driver, with GVA growth of 9.3% in H1 FY26 and 9.1% estimated for the full year.

Fiscal Developments: Anchoring Stability Through Credible Consolidation

  • Revenue Performance:
    • Centre’s revenue receipts rose to 9.2% of GDP in FY25 (PA), up from 8.5% in FY16–FY20.
    • Non-corporate tax collections increased from 2.4% of GDP pre-pandemic to 3.3% post-pandemic.
  • Tax Base Expansion:
    • Income tax return filings increased from 6.9 crore in FY22 to 9.2 crore in FY25, reflecting improved compliance and digital administration.
  • GST Collections:
    • Gross GST collections during April–December 2025 stood at ₹17.4 lakh crore, growing 6.7% YoY.
    • E-way bill volumes rose 21% YoY, indicating robust transaction activity.
  • Capital Expenditure:
    • Effective central government capex rose to 4% of GDP in FY25, from 2.7% pre-pandemic.
    • Under Special Assistance to States for Capital Expenditure (SASCI), states maintained capex at around 2.4% of GDP.
  • Debt and Deficit:
    • Combined state fiscal deficit edged up to 3.2% of GDP in FY25.
    • India reduced its general government debt-to-GDP ratio by 7.1 percentage points since 2020, while sustaining high public investment.

Monetary Management and Financial Intermediation

Banking Sector Performance

  • Asset Quality:
    • Gross Non-Performing Assets (GNPAs) reached a multi-decadal low of 2.2% in September 2025.
    • Net NPA ratio stood at 0.5%, a record low.
  • Credit Growth:
    • Outstanding credit grew 14.5% YoY as of December 2025, compared to 11.2% in December 2024.

Financial Inclusion

  • PM Jan Dhan Yojana (PMJDY):
    • 55.02 crore bank accounts opened as of March 2025, with 36.63 crore in rural and semi-urban areas.
  • Key Schemes:
    • Stand-Up India: Loans of ₹10 lakh–₹1 crore for SC, ST, and women entrepreneurs.
    • PM SVANidhi: Collateral-free loans to street vendors.
    • PM Mudra Yojana: Over ₹36.18 lakh crore disbursed across 55.45 crore loan accounts by October 2025.

Capital Markets and Financial Ecosystem

  • Investor Base:
    • Demat accounts crossed 21.6 crore, with 12 crore unique investors by September 2025—nearly 25% women.
    • Mutual fund industry reached 5.9 crore unique investors, with strong participation from non-tier-I and tier-II cities.
  • International Validation:
    • IMF–World Bank FSAP 2025 highlighted India’s resilient and diversified financial system, with total financial sector assets at 187% of GDP (CY 2024).

External Sector: Playing the Long Game

  • Trade Performance:
    • India’s share of global merchandise exports nearly doubled from 1% (2005) to 1.8% (2024).
    • Share of global services exports rose from 2% to 4.3% over the same period.
  • Exports and Remittances:
    • Total exports reached USD 825.3 billion in FY25, growing 6.1% YoY.
    • Services exports hit an all-time high of USD 387.6 billion, growing 13.6%.
    • India remained the world’s largest recipient of remittances, with inflows of USD 135.4 billion in FY25.
  • Current Account and Reserves:
    • Current Account Deficit (CAD) remained moderate at around 1.3% of GDP in Q2 FY26.
    • Foreign exchange reserves rose to USD 701.4 billion (16 January 2026), covering 11 months of imports and 94% of external debt.
  • FDI Inflows:
    • Gross FDI inflows reached USD 64.7 billion during April–November 2025.
    • India ranked fourth globally in Greenfield investment announcements in 2024 and emerged as the largest destination for Greenfield digital investments (2020–24).

Inflation: Tamed and Anchored

  • Headline Inflation:
    • Average CPI inflation during April–December 2025 stood at 1.7%, the lowest since the CPI series began.
    • Decline driven by moderation in food and fuel prices, which together account for 52.7% of the CPI basket.
  • Global Comparison:
    • India recorded one of the sharpest declines in inflation among EMDEs, with a reduction of 1.8 percentage points in 2025 over 2024.

Agriculture and Food Management

  • Production Trends:
    • Foodgrain production reached 3,577.3 lakh metric tonnes (LMT) in AY 2024–25, an increase of 254.3 LMT over the previous year.
    • Growth driven by rice, wheat, maize, and coarse cereals (Shree Anna).
  • Diversification:
    • Horticulture, accounting for 33% of agricultural GVA, reached 362.08 million tonnes, surpassing foodgrain output.
  • Marketing and Infrastructure:
    • e-NAM onboarded 1.79 crore farmers, 2.72 crore traders, and 4,698 FPOs, covering 1,522 mandis across 23 states and 4 UTs.
    • Agriculture Infrastructure Fund (AIF) and ISAM strengthened farm-gate facilities.
  • Income Support:
    • Over ₹4.09 lakh crore released under PM-KISAN since inception.
    • PM Kisan Maandhan Yojana (PMKMY) enrolled 24.92 lakh farmers as of December 2025.

Services: From Stability to New Frontiers

  • Contribution to GDP:
    • Services’ share in GDP rose to 53.6% in H1 FY26; GVA share reached 56.4%, the highest ever.
  • Global Position:
    • India is the world’s seventh-largest exporter of services, with its global share rising to 4.3%.
  • FDI Magnet:
    • Services accounted for 80.2% of total FDI during FY23–FY25.

Industry’s Next Leap: Structural Transformation and Global Integration

  • Industrial Growth:
    • Industry GVA grew 7.0% in H1 FY26.
  • Manufacturing Revival:
    • Manufacturing GVA grew 7.72% in Q1 and 9.13% in Q2 FY26, reflecting structural recovery.
  • PLI Schemes:
    • Across 14 sectors, PLI attracted over ₹2.0 lakh crore of actual investment, generating incremental production/sales of ₹18.7 lakh crore and over 12.6 lakh jobs.
  • Innovation and Semiconductors:
    • India’s Global Innovation Index rank improved to 38th (2025) from 66th (2019).
    • India Semiconductor Mission approved 10 projects with investments of ₹1.60 lakh crore.

Investment and Infrastructure: Strengthening Connectivity and Competitiveness

  • Capital Expenditure:
    • Government capex increased nearly 4.2 times, from ₹2.63 lakh crore (FY18) to ₹11.21 lakh crore (FY26 BE).
    • Effective capex in FY26 (BE) stands at ₹15.48 lakh crore.
  • Transport Infrastructure:
    • National Highway network expanded by 60%, reaching 1,46,572 km (FY26 up to December).
    • High-speed corridors increased nearly ten-fold from 550 km (FY14) to 5,364 km.
    • Rail network reached 69,439 route km, with 99.1% electrification by October 2025.
  • Aviation and Power:
    • India is the world’s third-largest domestic aviation market, with airports increasing from 74 (2014) to 164 (2025).
    • Installed power capacity reached 509.74 GW, with renewable energy forming 49.83% of total capacity.
  • Power Sector Reforms:
    • DISCOMs recorded a positive PAT of ₹2,701 crore in FY25, a historic first.
    • AT&C losses reduced from 22.62% (FY14) to 15.04% (FY25).
  • Digital and Water Infrastructure:
    • Tele-density reached 86.76%, and 5G services cover 99.9% of districts.
    • Over 81% of rural households have access to clean tap water under the Jal Jeevan Mission.
  • Space Sector:
    • India became the fourth nation to achieve autonomous satellite docking (SpaDeX).

Environment and Climate Change

  • During FY26 (up to 31 December 2025), 38.61 GW of renewable energy capacity was added, including:
    • 30.16 GW solar,
    • 4.47 GW wind,
    • 3.24 GW hydro, and
    • 0.03 GW bio-power.

Education and Health: What Works and What’s Next

Education

  • School Education:
    • India serves 24.69 crore students across 14.71 lakh schools, supported by 1.01 crore teachers.
    • Gross Enrolment Ratios (GER):
      • Primary: 90.9%
      • Upper Primary: 90.3%
      • Secondary: 78.7%
      • Higher Secondary: 58.4%
  • Higher Education:
    • Higher education institutions increased from 51,534 (2014–15) to 70,018 (June 2025).
    • India now has 23 IITs, 21 IIMs, and 20 AIIMS, plus international IIT campuses in Zanzibar and Abu Dhabi.
    • National Credit Framework (NCrF) adopted by 170 universities.
    • Academic Bank of Credit covers 2,660 institutions, with over 4.6 crore IDs issued.

Health

  • Mortality Reduction:
    • Since 1990, India reduced:
      • Maternal Mortality Rate (MMR) by 86%,
      • Under-Five Mortality Rate (U5MR) by 78%,
      • Neonatal Mortality Rate (NMR) by 70%.
    • Infant Mortality Rate declined from 40 (2013) to 25 (2023).

Employment and Skill Development: Getting Skilling Right

  • Employment Trends:
    • 56.2 crore people (aged 15+) were employed in Q2 FY26, with 8.7 lakh new jobs added over Q1 FY26.
    • Organised manufacturing employment grew 6% YoY in FY24, adding over 10 lakh jobs.
  • Labour Reforms:
    • Labour Codes formally recognised gig and platform workers, expanding social security and benefit portability.
  • Unorganised Workers:
    • e-Shram portal registered over 31 crore workers, with 54% women.
  • National Career Service (NCS):
    • Over 5.9 crore registered job seekers, 5.3 million job providers, and mobilisation of 80 million vacancies.
  • Skill Ecosystem:
    • National Scheme for Upgradation of ITIs aims to upgrade 1,000 government ITIs through modern infrastructure and industry-aligned courses.

Rural Development and Social Progress

  • Poverty Reduction:
    • As per NITI Aayog’s Multidimensional Poverty Index (MPI), poverty declined from 55.3% (2005–06) to 11.28% (2022–23).
    • World Bank revised poverty line to USD 3/day (2021 PPP); India’s poverty rates in 2022–23 stood at 5.3% (extreme) and 23.9% (lower-middle-income).
  • Social Services Expenditure:
    • Social services expenditure rose to 7.9% of GDP in FY26 (BE).
  • SVAMITVA and Rural Technology:
    • Drone surveys completed in 3.28 lakh villages.
    • 2.76 crore property cards issued.
    • Over 1,094 drones distributed to SHG Drone Didis, including 500 under Namo Drone Didi Scheme.

Evolution of the AI Ecosystem in India

  • The Survey emphasises smaller, task-specific AI models tailored to India’s low-resource and diverse settings.
  • AI demand is driven by real-world needs across healthcare, agriculture, urban management, education, disaster preparedness, and governance, promoting inclusive and decentralised innovation.

Urbanisation: Making India’s Cities Work

  • Initiatives like the Namo Bharat Regional Rapid Transit System (RRTS) are reshaping urban and peri-urban labour markets by reducing travel times, supporting polycentric growth, and easing pressure on metropolitan cores.

From Import Substitution to Strategic Resilience and Strategic Indispensability

The Survey proposes a disciplined Swadeshi approach through a three-tiered framework:

  1. Critical vulnerabilities with high strategic urgency.
  2. Economically feasible capabilities with strategic payoffs.
  3. Low-urgency or high-cost substitutions to be deprioritised.

It advocates:

  • A National Input Cost Reduction Strategy treating competitiveness as infrastructure.
  • A progression from Swadeshi → Strategic Resilience → Strategic Indispensability, aiming to embed India deeply in global value chains so that “buying Indian” becomes the natural choice.

FAQs

1. What growth rate does the Economic Survey 2025–26 project for FY26 ?

It projects real GDP growth at 7.4% and GVA growth at 7.3%, making India the fastest-growing major economy for the fourth consecutive year.

2. How has inflation performed according to the Survey ?

Average headline inflation during April–December 2025 stood at 1.7%, the lowest since the CPI series began, driven mainly by moderation in food and fuel prices.

3. What are the key achievements in financial inclusion ?

Under PMJDY, 55.02 crore bank accounts have been opened, and the investor base has expanded to 12 crore unique investors, with nearly 25% women.

4. What does the Survey say about India’s external sector ?

India’s exports reached USD 825.3 billion, services exports hit USD 387.6 billion, remittances touched USD 135.4 billion, and forex reserves rose to USD 701.4 billion.

5. What is meant by ‘Strategic Indispensability’ in the Survey ?

It refers to embedding India so deeply into global value chains that its products and services become essential to the world economy, moving beyond self-reliance to global indispensability.

What is the Indian Ocean Naval Symposium (IONS)? Key objectives, establishment, structure, member countries, and importance for India.

Why in News ?

  • The Indian Navy’s First Training Squadron (1st TS) recently departed from Belawan Port, Indonesia, after a successful three-day port visit.
  • The visit aimed to strengthen maritime cooperation with Indonesia, a key member of the Indian Ocean Naval Symposium (IONS), and to advance India’s vision of SAGAR (Security and Growth for All in the Region).

What is the Indian Ocean Naval Symposium (IONS) ?

  • The Indian Ocean Naval Symposium (IONS) is a voluntary and cooperative forum of navies of the littoral (coastal) states of the Indian Ocean Region (IOR).
  • Its main objective is to enhance dialogue, cooperation, and mutual trust on common maritime security challenges.

Key Objectives of IONS

  • Strengthening maritime security in the Indian Ocean Region
  • Promoting information sharing and confidence-building among navies
  • Cooperation in Humanitarian Assistance and Disaster Relief (HADR)
  • Addressing challenges such as piracy, smuggling, terrorism, and illegal activities
  • Coordination on maritime law, search and rescue, and environmental protection
  • Enhancing naval exercises, training, and capacity building

Establishment of IONS

  • Year of Establishment: 2008
  • Initiated by: Indian Navy
  • First Conclave: New Delhi, India
  • Objective: To promote a peaceful, secure, and cooperative maritime environment in the Indian Ocean.

Organizational Structure

IONS functions through:

  • Rotational Chairmanship
  • Biennial Conclave of Chiefs of Navies
  • Working Groups
  • Expert interactions and joint exercises

This structure supports both policy formulation and practical operational cooperation.

Four Sub-Regions of the Indian Ocean

There are 36 littoral states, divided into four sub-regions:

1. South Asian Littoral

  • Bangladesh
  • India
  • Maldives
  • Pakistan
  • Seychelles
  • Sri Lanka
  • United Kingdom (British Indian Ocean Territory)

2. West Asian Littoral

  • Iran
  • Oman
  • Saudi Arabia
  • United Arab Emirates (UAE)

3. East African Littoral

  • France (Reunion Island)
  • Kenya
  • Mauritius
  • Mozambique
  • South Africa
  • Tanzania

4. Southeast Asian and Australian Littoral

  • Australia
  • Indonesia
  • Malaysia
  • Myanmar
  • Singapore
  • Thailand
  • Timor-Leste

Observer Countries

  • China
  • Germany
  • Italy
  • Japan
  • Madagascar
  • Netherlands
  • Russia
  • Spain

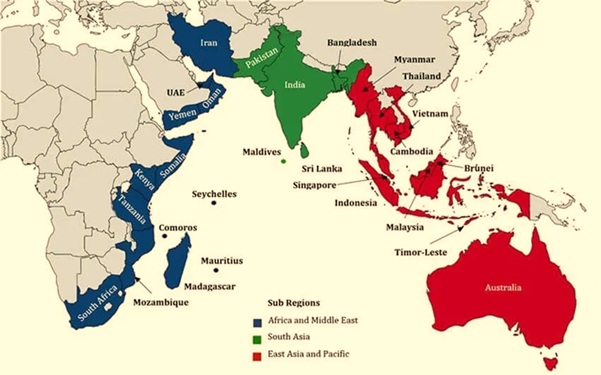
These countries participate in IONS activities in a cooperative capacity.

Importance of IONS for India

India is a founding member and a leading contributor to IONS. IONS strengthens three pillars of India’s maritime strategy:

  • SAGAR Vision
  • Indo-Pacific Cooperation
  • Blue Economy and Maritime Trade Security

India promotes regional trust through:

  • Training missions
  • Port visits
  • Joint naval exercises
  • HADR operations

Significance of the Recent Indonesia Engagement

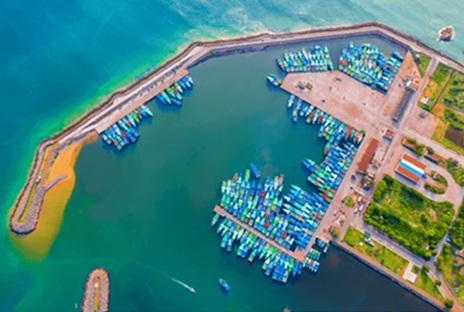
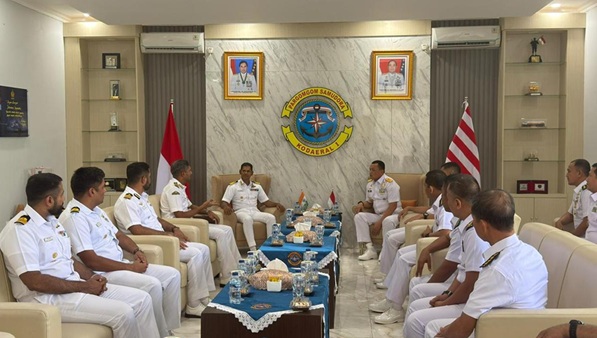
The Indian Navy’s 1st Training Squadron visited Indonesia to:

  • Enhance bilateral naval cooperation
  • Share maritime training practices
  • Strengthen regional stability
  • Provide international exposure to young naval cadets

This visit reinforces the core spirit of IONS — cooperation, trust, and collective maritime security.

Chattergala Pass And Border Roads Organisation (BRO)

Why in News ?

  • Recently, the Border Roads Organisation (BRO) successfully completed a high-altitude rescue operation and road reconstruction work at Chattergala Pass under Project Sampark.
  • The objective of this operation was to restore traffic movement in a difficult mountainous region, ensure smooth military mobility, and provide safe connectivity for local communities.
  • Despite extreme weather conditions, heavy snowfall, and landslide challenges, the mission was completed successfully, demonstrating BRO’s strong technical capability and emergency response preparedness.

About Chattergala Pass

Location

  • Chattergala Pass is located in the Jammu region of the Union Territory of Jammu and Kashmir.
  • It lies on the Bhadarwah–Chattergala Axis.
  • The pass connects Bani area of Kathua district with Bhadarwah in Doda district.
  • It is situated in the Chamba–Doda mountain ranges of the Greater Himalayas.

Geographical Features

  • It is a high-altitude mountain pass.
  • The region is characterized by:
    • Alpine grasslands
    • Snow-covered peaks
    • Dense deodar and pine forests
    • Narrow and winding mountain roads
  • During winters, heavy snowfall often leads to temporary closure of the route.

Biodiversity (Flora & Fauna)

  • The area is rich in biodiversity.
  • Major wildlife species found here include:
    • Himalayan Monal (State bird of Himachal Pradesh)
    • Ibex
    • Musk Deer
  • The region is ecologically sensitive.

Strategic and Security Importance

  • The pass:
    • Facilitates rapid movement of armed forces.
    • Supports border surveillance and logistics supply.
    • Plays a vital role in disaster relief and rescue operations.
  • It connects remote areas of the Jammu region with the main transport network.

Significance of Project Sampark

  • Project Sampark is a major BRO initiative aimed at:
    • Improving road connectivity in border and remote areas
    • Developing all-weather transport routes
    • Strengthening strategic preparedness
  • Reconstruction at Chattergala Pass will:
    • Enhance road safety
    • Promote tourism
    • Boost local economic activities

Border Roads Organisation (BRO)

  • BRO is a premier road construction and infrastructure agency of India.
  • It primarily provides logistics and infrastructure support to the Indian Armed Forces.

Establishment and Administration

  • Established: 7 May 1960
  • Objectives:
    • Construction of roads in border areas
    • Infrastructure development in remote regions of northern and northeastern India
  • Administrative Control:
    • Under the Ministry of Defence since 2015

Operational Area

  • Development and maintenance of:
    • Roads, bridges, and tunnels in India’s border regions
  • Also undertakes infrastructure projects in friendly neighboring countries.

Organisational Structure

  • Executive Head:
    • Director General Border Roads (DGBR)
  • Rank:equivalent to Lieutenant General
  • Core Cadre:
    • General Reserve Engineer Force (GREF)
  • Also includes officers and personnel on deputation from the Corps of Engineers of the Indian Army.

Motto:-“Shrameṇa Sarvam Sādhyam(Everything is achievable through hard work.)

Bacillus subtilis: State Microbe of Kerala

Why in News ?

Recently, the Government of Kerala officially declared Bacillus subtilis as its “State Microbe.” The objective is to promote biodiversity conservation, biotechnology research, and awareness of microbiology among students.

What is Bacillus subtilis ?

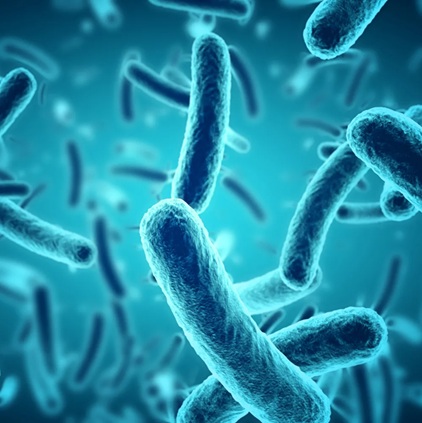
Bacillus subtilis is a probiotic bacterium, commonly known as a “good bacterium.” It is naturally found in:

  • The human gut
  • Fermented foods
  • Soil and plant surfaces

It is one of the most widely studied microorganisms in biology and biotechnology.

Major Characteristics of Bacillus subtilis

1. Structural Features

  • Spore-forming bacterium
  • Rod-shaped
  • Gram-positive
  • Motile
  • Facultative aerobe (can survive with or without oxygen)

2. Habitat

  • Mainly found in soil and vegetation
  • Optimal growth temperature: 25–35°C

3. Biological Capacity

  • Produces various antibiotics
  • Genome contains five signal peptidase genes that help in antibiotic secretion
  • Secretes:
    • Polymyxin
    • Difficidin
    • Subtilin
    • Mycobacillin

4. Endospore Ability

Endospores can survive extreme conditions:

  • UV radiation
  • High temperature
  • Dry environment

Can remain dormant for long periods

Transmission and Pathogenicity

  • Generally non-pathogenic
  • However:
    • Can contaminate food
    • Acts as an opportunistic pathogen in people with weak immunity

Applications of Bacillus subtilis

Agriculture

  • Used as a natural bio-fungicide
  • Competes with plant pathogens in root zones
  • Some strains produce toxins against insects
  • Supports organic farming

Scientific Research

  • Model organism for studying endospore formation
  • Used to test effectiveness of sterilants and sporicides
  • Helpful in gene expression and antibiotic research

Health and Industry

  • Used in probiotic supplements
  • Improves gut health
  • Used in enzyme and pharmaceutical production

Importance of Declaring it as State Microbe

  • Promotes scientific awareness
  • Encourages microbiology research
  • Supports organic agriculture and environmental protection
  • Develops innovation and scientific thinking among students

What are Microorganisms ?

Microorganisms are extremely small living organisms that cannot be seen with the naked eye and can only be observed using a microscope. They are found in water, air, soil, food, and inside the human body. Some microorganisms are beneficial, while others cause diseases.

Major Types of Microorganisms

1. Bacteria

  • Unicellular organisms
  • Found in soil, water, food, and the human body
  • Some are beneficial (curd making), some are harmful (TB, typhoid)

Examples: Bacillus subtilis, E. coli

2. Viruses

  • Inactive outside living cells
  • Active only inside host cells
  • Cause many infectious diseases

Examples: Coronavirus, Influenza virus

3. Fungi

  • Include yeast and molds
  • Can spoil food but are also useful

Examples: Yeast (bread making), Penicillium (penicillin medicine)

4. Protozoa

  • Unicellular eukaryotic organisms
  • Found in water

Examples: Amoeba, Plasmodium (malaria)

5. Algae

  • Perform photosynthesis
  • Mostly aquatic

Examples: Spirulina, Chlorella

Benefits of Microorganisms

  • Used in making curd, bread, vinegar, alcohol
  • Nitrogen fixation improves soil fertility
  • Production of medicines and antibiotics
  • Decomposition of waste
  • Used as bio-fertilizers and bio-pesticides

Harmful Effects of Microorganisms

  • Cause diseases – TB, cholera, malaria
  • Spoil food
  • Damage crops
  • Produce toxins

Uses of Microorganisms

Medical Field

  • Production of antibiotics
  • Vaccine preparation
  • Improve digestion as probiotics
  • Production of insulin and hormones
  • Disease diagnosis and testing

Agriculture

  • Increase soil fertility as bio-fertilizers
  • Pest control using bio-pesticides
  • Protection from plant diseases
  • Nutrient recycling in soil
  • Increase crop yield

Research

  • DNA and genetic studies
  • Testing of new medicines
  • Enzyme research
  • Biotechnology experiments
  • Genetic improvement

Industry

  • Production of curd, bread, alcohol, vinegar
  • Biofuel production
  • Textile and paper industry applications
  • Enzyme-based cleaning
  • Food preservation

Environmental Protection

  • Waste decomposition
  • Water purification (sewage treatment)
  • Oil spill cleanup
  • Pollution control
  • Biodiversity conservation
« »
  • SUN
  • MON
  • TUE
  • WED
  • THU
  • FRI
  • SAT
Have any Query?

Our support team will be happy to assist you!

OR
X