New
GS Foundation (P+M) - Delhi : 19th Jan. 2026, 11:30 AM Spring Sale UPTO 75% + 10% Off, Valid Till : 6th Feb., 2026 GS Foundation (P+M) - Prayagraj : 09th Jan. 2026, 11:00 AM Spring Sale UPTO 75% + 10% Off, Valid Till : 6th Feb., 2026 GS Foundation (P+M) - Delhi : 19th Jan. 2026, 11:30 AM GS Foundation (P+M) - Prayagraj : 09th Jan. 2026, 11:00 AM

Current Affairs for 31 January 2026

PAIMANA Portal

Why in News ?

The Ministry of Statistics and Programme Implementation (MoSPI) has launched a new web-based portal named PAIMANA for mandatory monitoring of Central Sector infrastructure projects with a project cost of 150 crore or more.

Full Form of PAIMANA

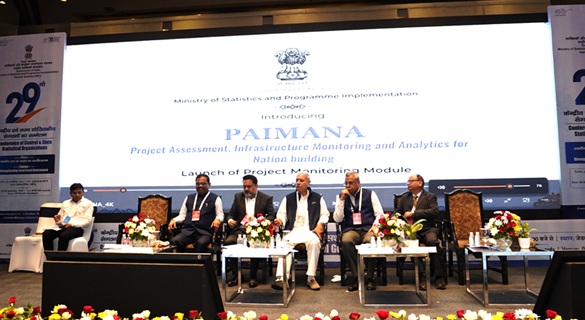
Project Appraisal, Infrastructure Monitoring And Nalytics for Nation Assistance

What is the PAIMANA Portal ?

  • A flagship digital initiative of MoSPI
  • Acts as a national-level centralized repository
  • Developed for monitoring, evaluation, and analysis of large infrastructure projects

Objectives

  • Ensure timely and effective monitoring of infrastructure projects
  • Improve data accuracy and operational efficiency
  • Enable web-based analytical reports to support policy formulation

Coverage

  • Central Sector infrastructure projects
  • Projects with an estimated cost of 150 crore and above

Technical Integration

  • Integrated through API with the Integrated Project Monitoring Portal (IPMP / IIG-PMG) of Department for Promotion of Industry and Internal Trade (DPIIT)

Key Features of PAIMANA Portal

1. Centralized Project Monitoring

  • Provides a single-window interface
  • Enables ministries, departments, and implementing agencies to:
    • Upload project data
    • Track progress
    • Review implementation status

2. Real-Time Dashboards

  • Equipped with drill-down capabilities
  • Allows monitoring:
    • Sector-wise
    • State-wise
    • Time-period wise

3. Advanced Data Analytics

  • Advanced analytical tools
  • Interactive dashboards
  • Role-based user access for enhanced security and accountability

Significance

  • Helps control project delays and cost overruns
  • Enhances transparency and accountability
  • Strengthens digital governance
  • Supports national infrastructure development planning

E-Methanol Plant

Context

Assam Petrochemicals Limited (APL) signed a Memorandum of Understanding (MoU) with the Deendayal Port Authority (DPA) to establish a 150-tonne-per-day (TPD) e-methanol plant at Kandla Port in Gujarat, marking a significant step towards India's transition to clean energy and green transformation.

About the E-Methanol Plant

  • The project will involve a capital investment of over ₹1,200 crore. This will result in the creation of approximately 3,500 direct and indirect employment opportunities.
  • Under this agreement, DPA will provide pipeline connectivity, storage, and fuel-handling infrastructure at the port. APL will establish a green methanol production facility within the port area, creating an integrated value chain for green marine fuel.
  • E-methanol, or electro-methanol, is produced using green hydrogen and captured carbon dioxide, powered by renewable electricity. It is considered one of the most viable alternative fuels for sectors such as shipping, heavy industry, and chemical manufacturing, where direct electrification remains challenging.

Assam Petro-Chemicals Limited

  • Assam-based APL Namrup operates one of the country's largest methanol facilities and recently expanded its production capacity.
  • The partnership with DPA and Kandla is expected to help the company move up the value chain from conventional methanol to green and e-methanol production.

About Kandla Port

  • Kandla was built in the 1950s as a major port in western India, after Karachi Port went to Pakistan after the partition of India and Pakistan.
  • Kandla Port is located on the Gulf of Kutch on India's northwestern coast, approximately 256 nautical miles southeast of Karachi Port in Pakistan and 430 nautical miles north-northwest of Mumbai (Bombay) Port. It is India's largest port by cargo volume.
  • As part of efforts to reduce carbon emissions, Kandla Port is being developed as a green bunkering hub to supply low- and zero-carbon fuel to ships plying international trade routes.
  • Kandla Port in Gujarat, located on India's west coast, is one of the ports being developed as a green hydrogen hub under the National Green Hydrogen Mission.
  • The mission aims to produce and export approximately 5 million tons of green hydrogen over the next 5 to 6 years. This initiative also contributes to India's commitment to achieving the target of net-zero carbon emissions by 2070, as outlined by the Prime Minister.

Menstrual Health and the Issue of Dignity and Equality in Educational Institutions

Context

  • Recently, the Supreme Court declared in a judgment that menstrual health and access to menstrual hygiene management (MHM) in educational institutions are integral to the fundamental right to life and dignity guaranteed under Article 21 of the Constitution.
  • This issue is not only related to health, but also to broader questions of education, gender equality, and human dignity. The judgment was delivered by a bench of Justices J.B. Pardiwala and R. Mahadevan.

Constitutional Perspective of the Judgment

  • The Court clarified that dignity is not an abstract ideal but rather refers to conditions in which a person can live without humiliation, exclusion, and unnecessary suffering.
  • The lack of access to MHM facilities for menstruating girls exposes them to stigma, stereotypes, and humiliation.
  • Due to the lack of safe and hygienic menstrual management, girl students are forced to either remain absent from school or resort to unsafe methods, which directly impacts their dignified lives.

Right to Education and Menstrual Poverty

  • The Court also underlined that menstrual poverty deprives girls of the right to a dignified education, equal to that of male students or those from better-off economic backgrounds.
  • Disruption of primary or secondary education has long-term and serious consequences. Thus, the lack of MHM facilities also undermines the constitutional guarantee of free and compulsory education.

Widespread Challenges of Menstrual Hygiene

  • Social and Cultural Taboos
  •  Increased Dropout
  • Frequent Infections and Health Risks
  • Lack of Sanitation Infrastructure and Waste Disposal

Violation of Privacy and Bodily Autonomy

  • This decision was based on a writ petition filed by Dr. Jaya Thakur, which highlighted the lack of MHM facilities in schools across the country.
  • The Court held that the absence of MHM measures in schools violates the right to privacy and bodily autonomy of female students.

Supreme Court Directives

  • The Court issued comprehensive directives to states and union territories, primarily including the following:
    • Ensure the availability of functional, gender-segregated toilets in all schools, government and private, urban and rural.
    • Provide free oxo-biodegradable sanitary napkins to female students. This should preferably be done through sanitary napkin vending machines in the toilet premises.
    • MHM corners should be established in schools, providing spare underwear, spare uniforms, disposable bags, and other essential materials.

Some relevant constitutional provisions

Article

Name of the Provision

Brief Description

Article 21

Right to Life and Personal Dignity

Guarantees the right to live with dignity, including health, hygiene, and personal liberty

Article 14

Right to Equality

Ensures equality before the law and equal protection of laws

Article 15

Prohibition of Gender-Based Discrimination

Prohibits discrimination on grounds of sex and other specified bases

Article 21A

Right to Education

Provides free and compulsory education to children aged 6–14 years

Article 47 (DPSP)

Promotion of Public Health

Directs the State to improve nutrition levels and public health

Dignity, autonomy, and choice

  • The Court clarified that a girl has a perfectly legitimate expectation to be able to manage her menstruation with privacy and dignity. Lack of resources cannot be allowed to override her bodily autonomy.
  •  MHM is not limited to hygiene alone, but also includes freedom of choice, availability of adequate products, water, and clean disposal mechanisms.

The Unreality of the Choice of 'Dignity vs. Education'

  • The Court stated that the state cannot force a girl child to choose between dignity and education.
  • The unavailability of sanitary napkins creates a gender-specific barrier that impacts school attendance and the continuation of education.
  • In a separate section of the judgment, the Court emphasized the need to educate and sensitize male teachers and students about the biological reality of menstruation, so as to avoid harassment, humiliation, or unnecessary questioning of menstruating female students.

RTE Act and Accountability

  • If government schools do not comply with Section 19 of the RTE Act, 2009 (standards including separate toilets for boys and girls), the state will be held liable.
  • For private schools, non-compliance provides for cancellation of recognition and other punitive actions.

Some Government Initiatives

  • Menstrual Hygiene Scheme under the National Health Mission (NHM)
  • Construction of toilets in schools under the Samagra Shiksha Abhiyan
  • Emphasis on sanitation infrastructure through the Swachh Bharat Mission

Way Forward

  • Setting universal sanitation standards in schools
  • Regular and free availability of sanitary pads
  • Incinerators or eco-friendly solutions for safe disposal
  • Making menstrual education part of the school curriculum
  • Better coordination between central, state, and private institutions

Conclusion

This Supreme Court decision integrates menstruation into the broader constitutional discourse of health, education, dignity, and equality. It not only provides a rights-based safeguard for girl students but also elevates the state's role from a welfare responsibility to a constitutional one. This decision marks a significant step towards gender justice and dignified education in Indian democracy.

India’s New CPI Series: Lower Food Weight, Higher Housing Impact

Prelims: (Economy + CA)
Mains: (GS 3 – Inflation, Monetary Policy, Data Reforms)

Why in News ?

According to documents released by the Ministry of Statistics and Programme Implementation (MoSPI), India’s revised Consumer Price Index (CPI) series with 2024 as the base year will significantly reduce the weight of food and beverages from 45.86% to 36.75%.

At the same time, housing will account for a much larger share of the CPI basket. Along with improved methods to measure rent increases, this change is expected to push up measured housing inflation and exert upward pressure on headline retail inflation.

Background: Why Food’s High Weight in CPI Has Been a Concern

Food items dominate India’s CPI basket, meaning sharp swings in food prices often drive headline inflation—regardless of broader price trends in the economy.

  • From June 2025, food inflation turned negative, with prices consistently lower than a year earlier.
  • This sharply pulled down headline CPI inflation, which fell to an all-time low of 0.25% in October 2025, alongside record-low food inflation of –5.02%.

Such episodes highlight how food price volatility can distort the inflation signal, complicating both economic analysis and policy decisions.

Impact of New CPI Weights on Inflation Readings

Experts estimate that recalculating CPI with the new weights (while keeping price indices unchanged) would imply:

  • When food inflation is low, overall CPI could be 20–30 basis points higher than under the current series.
  • During periods of high food inflation, CPI could be 20–30 basis points lower than in the existing series.

Thus, the revised weights are expected to make headline inflation less volatile and more reflective of underlying price trends.

Why the RBI Has Been Uneasy with the Current CPI

For the Reserve Bank of India (RBI), the heavy food weight poses challenges because:

  • The current CPI is based on 2011–12 consumption patterns, making it outdated.
  • According to Engel’s Law, as incomes rise, the share of income spent on food declines—a trend confirmed by recent Indian data.

Based on the 2023–24 Household Consumption Expenditure Survey (HCES):

  • Rural households: Food share fell from 52.9% (2011–12) to 47.04%.
  • Urban households: Food share declined from 42.62% to 39.68%.

These shifts justify reducing food’s weight to make CPI more current, stable, and representative of actual consumption patterns.

Relief for RBI from Lower Food Weight in CPI

The RBI manages inflation mainly by influencing demand through interest rates. However, it has limited control over supply-side food price shocks, such as poor harvests or global commodity spikes.

In the past:

  • High food inflation has kept headline inflation elevated,
  • Preventing the RBI from cutting interest rates even when demand conditions were weak.

The Economic Survey 2023–24 suggested exploring inflation targeting that excludes food, but the RBI opposed this, arguing that persistent food inflation cannot be ignored.

Under the current Flexible Inflation Targeting (FIT) framework:

  • The RBI targets 4% CPI inflation, with a tolerance band of 2–6%.
  • This framework is under review, with the next five-year target (from April) expected to be announced by March.

While the FIT framework is likely to remain unchanged, the lower food weight in CPI could give the RBI greater operational comfort in managing inflation and interest rates.

New CPI Basket: What Is Changing

Timeline for the New CPI Series

  • Broad category weights have been released.
  • The first inflation data under the new series will be published on February 12 (for January).
  • Detailed item-wise weights will be released beforehand.

Expanded Coverage: More Items in the Basket

  • The new CPI basket will include 358 items, up from 299 earlier, reflecting evolving consumption patterns.

Reclassification of Categories

  • CPI categories have been reorganised, making direct comparison with the old series difficult.
  • For example:
    • Education services now carry a 3.33% standalone weight.
    • Earlier, education was a sub-group under “miscellaneous” with a 4.46% weight.

Linking Old and New CPI Series

  • To ensure continuity, an expert group has recommended publishing a linking factor between CPI 2012 and CPI 2024 for all-India, rural, and urban indices with the first CPI 2024 release.

Food Weight Falls; Housing Gains Prominence

  • Food and beverages: Weight falls from 45.86% → 36.75%, reducing volatility.
  • Housing: Weight rises sharply from 10.07% → 17.66%, making it a much more influential driver of inflation.

Why Housing Weight Is Rising

The increase reflects:

  • Expanded coverage to include residential utilities such as:
    • Water,
    • Electricity,
    • Gas,
    • Other fuels.
  • Higher spending on rent, as per the 2023–24 HCES:
    • Rural rent share: Rose from 0.45% → 0.56%.
    • Urban rent share: Increased from 6.24% → 6.58%.

Additionally, methodological changes—such as excluding employer-provided accommodation from rent measurement—are expected to raise measured housing inflation.

Implications for Inflation and Monetary Policy

  • Lower food weight should reduce headline CPI volatility and make inflation data more stable.
  • However, the higher housing weight, combined with improved rent measurement, could:
    • Push up housing inflation,
    • Place upward pressure on overall CPI,
    • Potentially affect interest rate decisions.

Overall, the new CPI series is likely to produce inflation readings that are more representative of modern consumption, but also structurally higher in some periods due to housing costs.

Way Forward: Making Inflation Measurement More Effective

To maximise the benefits of the new CPI series, policymakers should:

  • Ensure transparent communication of changes and linking factors.
  • Regularly update consumption weights to prevent future obsolescence.
  • Complement CPI with core inflation measures and alternative price indicators.
  • Use improved data to strengthen monetary-fiscal coordination.
  • Monitor housing inflation closely and align urban housing policy with inflation management goals.

These steps will help ensure that inflation measurement remains robust, credible, and policy-relevant in a rapidly changing economy.

FAQs

Why is food’s weight being reduced in the CPI basket ?

Because household spending on food has declined over time, and a high food weight makes inflation excessively volatile and less representative of current consumption patterns.

How will the new CPI weights affect inflation readings ?

CPI could be 20–30 basis points higher when food inflation is low and 20–30 basis points lower when food inflation is high, reducing overall volatility.

Why is housing’s weight increasing in the new CPI ?

Due to expanded coverage of residential utilities and higher spending on rent, as reflected in the latest household consumption data.

How does this change help the RBI ?

A lower food weight reduces the impact of supply-driven food price shocks on headline inflation, giving the RBI more operational flexibility in setting interest rates.

When will the new CPI series be implemented ?

The first inflation data under the new CPI series will be released in February, with detailed item-wise weights published beforehand.

Jal Jeevan Mission: From Tap Coverage to Functional Water Security in Rural India

Prelims: (Polity & Governance + CA)
Mains: (GS 2 – Governance, Welfare Schemes, Service Delivery; GS 3 – Water Resources, Sustainable Development)

Why in News ?

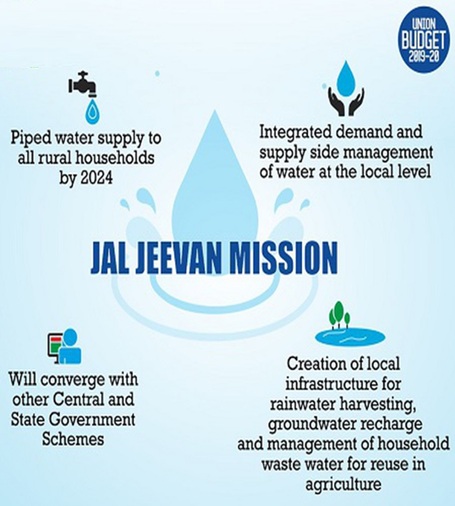
A 2024 government-commissioned survey has revealed that although nearly 98% of rural households now have tap connections under the Jal Jeevan Mission (JJM), only about three-fourths actually receive a regular, safe, and adequate water supply, exposing a gap between coverage and functionality.

Background: Jal Jeevan Mission and India’s Rural Water Challenge

India has historically struggled with rural drinking water access due to groundwater depletion, water quality issues, and institutional fragmentation. Previous schemes focused largely on infrastructure creation rather than service delivery.

Launched in 2019, the Jal Jeevan Mission marked a paradigm shift by prioritising functional household tap connections (FHTCs) and regular service delivery rather than mere installation of infrastructure. It represents one of the largest public investments in water security globally and is central to achieving SDG 6 (Clean Water and Sanitation).

What is the Jal Jeevan Mission ?

The Jal Jeevan Mission is a flagship programme of the Government of India aimed at providing:

  • Functional Household Tap Connections (FHTCs) to all rural households.
  • 55 litres of potable water per person per day, supplied on a regular basis.
  • Emphasis on:
    • Water quality
    • Source sustainability
    • Community participation
    • Village-level governance

Unlike earlier supply-driven schemes, JJM follows a service delivery approach, where success is measured by regularity, adequacy, and safety of water supply. The programme is implemented through a Centre-State partnership, with cost-sharing arrangements varying across States.

Current Status of Rural Tap Water Coverage

The Jal Jeevan Mission has expanded rural water infrastructure at an unprecedented scale:

  • Rural tap water coverage increased from less than 20% in 2019 to nearly universal connectivity by 2024–25.
  • States such as Goa, Gujarat, Andhra Pradesh, and several Union Territories report over 97% tap coverage.
  • By early 2026, more than 2.7 lakh villages were certified as “Har Ghar Jal” villages, meaning all households and public institutions have tap connections.

However, these certifications are largely based on infrastructure availability, not on actual service delivery, and do not fully capture functionality, water quality, or reliability.

Functionality and Water Quality Concerns

The core objective of JJM is not just installing taps, but ensuring functional and safe water supply. The 2024 Functionality Assessment Survey revealed major gaps:

  • Only 83% of households received water through taps at least once in the previous seven days.
  • Merely 80% met the quantity norm of 55 litres per capita per day.
  • Water quality tests (E. coli, faecal coliform, pH levels) showed that only 76% of households received water meeting basic safety standards.

When availability, regularity, and quality were assessed together, only around 75% of households were found to be benefiting from the scheme as intended, highlighting a significant gap between physical coverage and actual service outcomes.

Regional Variations in Performance

The survey exposed sharp inter-State disparities:

  • Better-performing States (often coastal or with stronger institutions) recorded high levels of functionality and water quality.
  • Lagging States such as Bihar, Uttar Pradesh, Nagaland, and Sikkim performed poorly on availability and quantity benchmarks.
    • Bihar reported tap water flow in only about 61% of households.
    • Sikkim showed particularly low compliance with per capita supply norms.

These variations reflect differences in:

  • Water source sustainability
  • Groundwater availability
  • Terrain and climate conditions
  • Administrative capacity and local governance effectiveness

Financial and Implementation Challenges

The Jal Jeevan Mission is among the most resource-intensive welfare programmes in India:

  • Since 2019, over ₹3.6 lakh crore has been spent on rural water infrastructure.
  • However, recent budgets show underutilisation of allocated funds in some years, indicating implementation and absorptive capacity challenges.

The original target of achieving 100% functional coverage by 2024 has now been extended to 2028, acknowledging difficulties related to:

  • Last-mile delivery
  • Operation and maintenance (O&M)
  • Water source sustainability

Estimates suggest that addressing remaining uncovered and non-functional households could require nearly ₹4 lakh crore in additional investment.

Institutional and Monitoring Framework

To improve performance and accountability, JJM relies on:

  • Village Water and Sanitation Committees (VWSCs)
  • Real-time dashboards
  • Third-party functionality surveys

The 2024 assessment covered over 2.3 lakh households across certified Har Ghar Jal villages, offering a more realistic picture beyond official coverage statistics.

However, the Ministry has noted that survey results are not directly comparable with earlier assessments due to changes in methodology and scope, indicating a need for consistent and standardised monitoring frameworks.

Way Forward: From Infrastructure to Sustainable Water Services

Ensuring long-term success of the Jal Jeevan Mission requires a strategic shift from infrastructure expansion to system sustainability:

  • Strengthening local operation and maintenance systems.
  • Enhancing water source recharge and conservation, especially groundwater management.
  • Improving water quality surveillance and laboratory infrastructure.
  • Empowering Panchayats, user committees, and women’s self-help groups in water governance.
  • Integrating JJM with sanitation, nutrition, public health, and climate adaptation programmes.
  • Promoting climate-resilient water planning, especially in drought-prone and water-stressed regions.

Only by focusing on functionality, quality, and sustainability can tap coverage be translated into real improvements in health, productivity, and rural welfare.

FAQs

What is the main objective of the Jal Jeevan Mission ?

To provide functional household tap connections supplying 55 litres of safe drinking water per person per day to all rural households.

Why is there a gap between tap coverage and actual water supply ?

Because infrastructure availability does not always ensure regular water delivery, adequate quantity, or safe quality due to source, maintenance, and governance challenges.

Which States are lagging behind in functionality under JJM ?

States such as Bihar, Uttar Pradesh, Nagaland, and Sikkim have reported lower water availability and quantity compliance.

What are the major financial challenges facing JJM ?

High capital requirements, underutilisation of funds in some years, and the need for additional investments to achieve full functional coverage by 2028.

What measures are needed to ensure sustainability of rural water supply ?

Strengthening local institutions, improving source sustainability, enhancing water quality monitoring, and integrating water supply with climate resilience and health programmes.

Pechora Air Defence System: Revitalising India’s Legacy Missile Shield

Prelims: (Defence & Security + Science & Technology + CA)
Mains: (GS 3 – Defence Technology, Indigenisation, Internal Security)

Why in News ?

Bengaluru-based defence manufacturer Alpha Design Technologies Ltd (ADTL) has completed a major upgrade of the Indian Air Force’s Pechora surface-to-air missile (SAM) system, aligning with the government’s push to modernise ageing military platforms through indigenous capability and self-reliance.

Background: Modernising India’s Legacy Air Defence Systems

India’s air defence architecture includes a mix of legacy Soviet-era systems and modern indigenous and imported platforms. Many older systems, though structurally sound, require technological upgrades to remain effective against evolving aerial threats such as drones, cruise missiles, and electronic warfare environments.

The Pechora system, inducted decades ago, continues to serve as a critical component of India’s low- to medium-altitude air defence grid, especially for point defence of strategic installations. The recent upgrade reflects India’s broader defence policy focus on:

  • Indigenisation,
  • Life-cycle extension of existing platforms, and
  • Reducing dependence on foreign suppliers.

What is the Pechora Missile System ?

The Pechora, officially designated as the S-125 Neva/Pechora, is a Soviet-origin, medium-range surface-to-air missile (SAM) system designed to intercept low- and medium-altitude aerial targets.

It was originally developed to counter:

  • Aircraft,
  • Cruise missiles, and
  • Low-flying aerial threats.

Over time, it has been adapted and upgraded by several countries, including India, to meet modern operational requirements.

Key Features and Components

The Pechora system comprises:

  • Radar-guided missile launcher
  • Fire control unit
  • Command and control elements

Missile

  • Typically employs the V-600 missile.

Radar

  • Uses the 4R90 Yatagan radar, equipped with five parabolic antennas, which enables:
    • Target detection,
    • Tracking,
    • Lock-on and guidance.

Operational Capabilities

  • Highly effective against:
    • Slow-moving targets,
    • Low-flying aircraft,
    • Drones, and
    • Cruise missiles.
  • Can operate:
    • As a standalone system, or
    • As part of a larger integrated air defence network.
  • Designed to function in electronically contested environments, including areas with heavy jamming.

Range, Altitude, and Detection Capabilities

    • Operational firing range: Up to 30–35.4 km.
    • Engagement altitude: From as low as 20 metres to about 20–25 km, allowing it to counter both low- and medium-altitude threats.
    • Detection range: Radar can detect targets up to 100 km away, providing early warning and engagement time.

These parameters make Pechora particularly suited for point defence of high-value assets such as air bases, industrial installations, and urban centres.

Significance of the Indigenous Upgrade

The modernisation of Pechora by ADTL represents a major step in:

  • Extending the operational life of critical air defence assets.
  • Enhancing:
    • Accuracy,
    • Reliability, and
    • Electronic counter-countermeasure (ECCM) capabilities.
  • Reducing dependence on:
    • Foreign spares,
    • Obsolete components, and
    • External maintenance support.

This aligns with national initiatives such as:

  • Atmanirbhar Bharat, and
  • Defence Acquisition Procedure (DAP) reforms aimed at boosting domestic defence manufacturing.

Strategic and Operational Relevance

In the evolving security environment, aerial threats increasingly include:

  • Unmanned aerial vehicles (UAVs),
  • Low-observable cruise missiles, and
  • Electronic warfare-enabled platforms.

Upgraded legacy systems like Pechora:

  • Provide cost-effective air defence coverage,
  • Complement modern systems such as Akash, MR-SAM, and S-400, and
  • Ensure layered air defence architecture across multiple altitudes and ranges.

Way Forward: Strengthening India’s Air Defence Ecosystem

To further enhance air defence readiness, India should:

  • Continue upgrading legacy systems with indigenous technology.
  • Integrate older platforms into network-centric warfare frameworks.
  • Expand R&D and private sector participation in defence manufacturing.
  • Prioritise development of counter-drone and electronic warfare capabilities.
  • Accelerate deployment of next-generation SAM systems while optimally utilising upgraded legacy assets.

Such a multi-layered and indigenised approach will ensure sustained air defence preparedness in an increasingly contested aerial domain.

FAQs

What is the Pechora missile system ?

The Pechora, or S-125 Neva/Pechora, is a Soviet-origin medium-range surface-to-air missile system designed to intercept low- and medium-altitude aerial targets.

Why is the Pechora system being upgraded ?

To extend its service life, improve performance, and align it with modern air defence requirements through indigenous technology.

What types of targets can Pechora effectively engage ?

Low-flying aircraft, drones, cruise missiles, and slow-moving aerial threats.

What are the range and altitude capabilities of the system ?

It has a firing range of up to 30–35.4 km and can engage targets from 20 metres up to 20–25 km in altitude.

How does the Pechora upgrade support India’s defence strategy ?

It strengthens self-reliance, enhances layered air defence, and reduces dependence on foreign defence suppliers.

Kyasanur Forest Disease: Understanding India’s Tick-Borne Viral Threat

Prelims: (Science & Technology + Health + CA)
Mains: (GS 2 – Public Health, Disease Control; GS 3 – Environment, Biodiversity & Zoonotic Diseases)

Why in News ?

A 29-year-old man in Karnataka recently lost his life after contracting Kyasanur Forest Disease (KFD), commonly known as monkey fever. The incident has brought renewed attention to a disease that often remains underreported until outbreaks turn fatal.

Background: Emergence and Public Health Significance of KFD

Kyasanur Forest Disease is a zoonotic viral illness that primarily affects forest-dwelling populations in southern India. First identified in 1957 in the Kyasanur Forest region of Karnataka, the disease has since remained endemic in parts of Karnataka and has gradually spread to neighbouring States.

The disease highlights the growing interface between human activity, wildlife habitats, and vector-borne infections, making it a key concern in the context of emerging infectious diseases and environmental change.

What is Kyasanur Forest Disease (KFD) ?

Kyasanur Forest Disease is a tick-borne viral haemorrhagic fever caused by the KFD virus, which belongs to:

  • Family: Flaviviridae
  • Genus: Flavivirus
  • Part of the tick-borne encephalitis (TBE) complex.

It is also referred to as:

  • Monkey fever or monkey disease, due to its strong association with monkey deaths that often precede human outbreaks.

KFD is primarily reported from southern India, especially forested and semi-forested regions.

Geographical Distribution and At-Risk Populations

Originally confined to Karnataka, KFD has now been reported in:

  • Goa
  • Maharashtra
  • Kerala
  • Tamil Nadu

Populations at higher risk include:

  • Forest workers
  • Farmers and cattle grazers
  • Tribal communities
  • People living near forest fringes

Seasonal patterns are observed, with most cases occurring during dry months, when human exposure to ticks increases.

Transmission Mechanism

KFD is transmitted through hard ticks, particularly Hemaphysalis spinigera.

Key modes of transmission include:

  • Tick bites while working or walking in forested areas.
  • Direct contact with infected animals, especially sick or recently dead monkeys.
  • The virus circulates in wildlife reservoirs such as monkeys, rodents, and small mammals.

Importantly:

  • KFD does not spread from person to person, which limits human-to-human transmission but does not reduce outbreak potential in high-risk zones.

Clinical Features and Disease Progression

KFD typically presents with a sudden onset of symptoms, including:

  • High-grade fever
  • Severe weakness and prostration
  • Headache
  • Nausea, vomiting, and diarrhoea
  • Muscle pain

In some cases, patients may develop:

  • Haemorrhagic manifestations (bleeding tendencies)
  • Neurological complications such as altered consciousness or tremors

The disease may follow a biphasic course, where initial recovery is followed by a second phase with neurological symptoms.

Diagnosis and Treatment

Diagnosis

  • Confirmed through laboratory tests such as RT-PCR or serological assays in specialised laboratories.

Treatment

  • There is no specific antiviral cure for KFD.
  • Management is supportive, focusing on:
    • Maintaining fluid and electrolyte balance
    • Oxygen therapy
    • Blood pressure management
    • Treating secondary infections and complications

Early diagnosis and prompt supportive care significantly improve survival outcomes.

Vaccination and Preventive Strategies

A vaccine against KFD is available in India and is recommended in endemic areas.

Key preventive measures include:

  • Routine vaccination of populations in high-risk zones.
  • Booster doses for sustained immunity.
  • Tick control measures, including use of repellents and protective clothing.
  • Avoidance of forest areas during outbreaks.
  • Public awareness campaigns on safe handling of sick or dead animals, especially monkeys.

Public Health Significance and Way Forward

KFD represents a broader challenge of emerging zoonotic diseases linked to environmental change, deforestation, and human-wildlife interactions.

Going forward, priorities should include:

  • Strengthening disease surveillance in forested regions.
  • Expanding vaccination coverage in endemic and at-risk areas.
  • Enhancing laboratory capacity for rapid diagnosis.
  • Promoting One Health approaches, integrating human, animal, and environmental health systems.
  • Investing in community education and early warning mechanisms to reduce mortality and outbreak spread.

FAQs

What causes Kyasanur Forest Disease ?

KFD is caused by the Kyasanur Forest Disease virus, a member of the Flavivirus genus in the Flaviviridae family.

How is KFD transmitted to humans ?

Through bites from infected hard ticks or contact with infected animals, especially sick or dead monkeys.

Can KFD spread from person to person ?

No, KFD does not spread through human-to-human transmission.

Is there a cure for KFD ?

There is no specific cure; treatment is supportive and focused on managing symptoms and complications.

How can KFD be prevented ?

Through vaccination in endemic areas, tick control measures, protective clothing, avoiding forest exposure during outbreaks, and community awareness.

Union Budget 2026–27: Navigating Growth, Revenue, and Investment Headwinds

Prelims: (Economy + CA)
Mains: (GS 3 – Indian Economy, Growth, Fiscal Policy, Investment)

Why in News ?

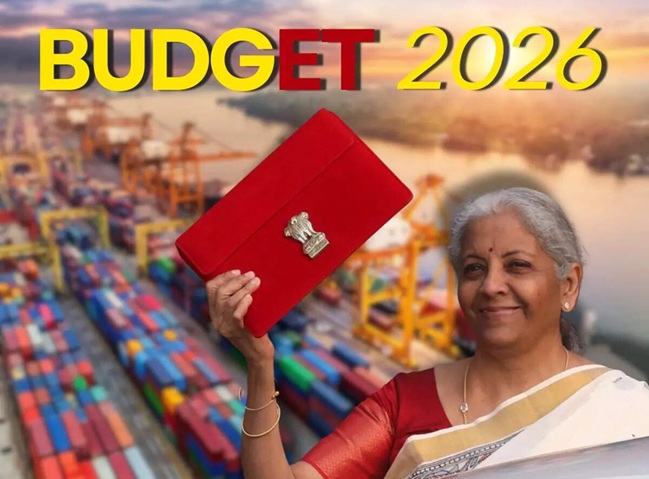
The Union Budget for 2026–27, to be presented by Finance Minister Nirmala Sitharaman, will outline:

  • The government’s growth expectations and spending priorities,
  • Projected revenues from tax and non-tax sources, and
  • The level of borrowing (fiscal deficit) required to bridge the gap between income and expenditure.

While the Budget marks the start of a new financial year, it is rarely a blank slate. Fiscal realities, committed expenditures, and policy continuity from previous years significantly limit room for radical change, making current-year economic conditions crucial in shaping Budget choices.

Background: Why a New Budget Has Limited Room for Change

A Union Budget operates within strong structural constraints:

  • Committed expenditures such as salaries, pensions, interest payments, and major subsidies cannot be easily altered.
  • Tax structures also change gradually due to political, economic, and administrative considerations.
  • The Finance Minister’s decisions are shaped heavily by the state of government finances in the ongoing year.

External shocks—such as export slowdowns triggered by global trade tensions or US tariffs—often spill over into the next fiscal year, forcing the Budget to respond to inherited stresses rather than introducing entirely new priorities.

Thus, a review of the year just ended provides critical insight into what the upcoming Budget can realistically achieve.

What Current-Year Data Signals: Three Key Macro Concerns

Recent economic data point to several issues, but three macroeconomic challenges stand out as particularly relevant for Budget 2026–27:

  1. Weak Nominal GDP Growth
  2. Low Tax Buoyancy
  3. Persistently Weak Private Corporate Investment

Together, these threaten fiscal stability, revenue mobilisation, and long-term growth prospects.

Weak Nominal GDP Growth: A Key Budget Worry

While real GDP growth often dominates headlines, it is nominal GDP growth—the value of output at current prices—that matters most for Budget arithmetic. It forms the base for:

  • Tax revenue projections,
  • Spending plans, and
  • Borrowing requirements.

The Budget Arithmetic Problem

If nominal GDP grows slower than expected:

  • Tax collections fall short, and the government must either:
    • Borrow more, potentially crowding out private investment and raising interest rates, or
    • Cut spending, limiting resources for infrastructure, R&D, and welfare.

A Sustained Slowdown

India’s nominal GDP growth has been decelerating for several years. For the current year, it is estimated at just 8%, far below:

  • The 10.1% growth assumed in last year’s Budget, and
  • The average growth rates seen over the past two decades.

This reflects a broader secular slowdown in the economy.

Implications for Budget 2026–27

With the First Advance Estimates pegging nominal growth at 8%, fiscal space has tightened considerably. The foremost challenge for the Finance Minister will be to craft a strategy that:

  • Raises nominal growth in the coming year, and
  • Stabilises revenues without forcing painful trade-offs between borrowing and spending.

Weak Tax Buoyancy: Revenues Falling Short of Expectations

Tax buoyancy measures how tax revenues respond to economic growth:

  • A buoyancy of 1 means tax revenues rise in proportion to GDP.
  • Budgets often assume buoyancy above 1 to fund expanding expenditure.

When nominal GDP growth is weak and buoyancy is low, revenue shortfalls multiply.

What’s Happening This Year ?

  • Actual tax collections are lagging behind Budget assumptions across major categories.
  • Year-to-date tax growth is below even the weak nominal GDP growth rate of around 8%.
  • While the Budget assumed a tax buoyancy of 1.1, actual buoyancy appears closer to 0.6.

In effect, tax revenues are growing at barely half the pace anticipated relative to GDP.

Implications for the Budget

Low tax buoyancy:

  • Further tightens fiscal space,
  • Forces difficult choices between higher borrowing and expenditure restraint, and
  • Complicates planning for social sector spending, capital expenditure, and fiscal consolidation targets.

Weak Private Corporate Investment: A Persistent Growth Challenge

A central objective of recent economic policy has been to expand the role of the private sector under the principle of “Minimum Government, Maximum Governance.”

Since 2019, this strategy has included:

  • Sharp corporate tax cuts,
  • Large increases in public capital expenditure, and
  • Targeted incentives such as the Production Linked Incentive (PLI) scheme to lower costs and crowd in private investment.

When investment did not respond as expected, the government shifted towards boosting demand, including:

  • Raising income tax exemptions, and
  • Cutting GST rates to improve sales prospects.

Investment Still Below Pre-Pandemic Levels

Despite these measures and strong headline GDP growth:

  • Private corporate investment remains below pre-pandemic (2019) levels.
  • Firms remain cautious, primarily due to weak sales growth and uncertain demand conditions, which do not justify large-scale capacity expansion.

Adding to the challenge:

  • Foreign investors have reduced exposure to India in recent periods.
  • This has exerted pressure on the rupee, creating both economic and political challenges for the Finance Minister.

The Budget Dilemma

The central policy question for Budget 2026–27 is:

  • How to revive private investment in an environment of weak demand, tight fiscal space, and global uncertainty.

This involves deciding:

  • What additional fiscal incentives, structural reforms, or regulatory changes are required,
  • How to restore investor confidence, and
  • How to balance short-term growth support with medium-term fiscal consolidation.

Way Forward: Recalibrating Growth, Revenue, and Investment Strategy

To address the three macro challenges, the Budget must pursue a multi-pronged approach:

  • Boost nominal GDP growth through targeted public investment, export promotion, and productivity-enhancing reforms.
  • Improve tax buoyancy by broadening the tax base, improving compliance, and rationalising exemptions without dampening growth.
  • Revive private investment by strengthening demand, reducing regulatory uncertainty, improving ease of doing business, and ensuring macroeconomic stability.
  • Maintain a credible fiscal consolidation path while protecting capital expenditure and priority social spending.
  • Enhance policy coordination between fiscal, monetary, and structural reforms to ensure a coherent growth strategy.

Only through such a calibrated approach can Budget 2026–27 navigate the tight fiscal environment while laying the foundation for durable, private investment–led growth.

FAQs

Why is nominal GDP growth more important for the Budget than real GDP growth ?

Because tax revenues, spending plans, and borrowing needs are calculated on nominal GDP, not real GDP.

What is tax buoyancy and why does it matter ?

Tax buoyancy measures how tax revenues respond to GDP growth. Low buoyancy means revenues rise more slowly than the economy, tightening fiscal space.

Why has private corporate investment remained weak despite policy incentives ?

Firms remain cautious due to weak demand, insufficient sales growth, and global economic uncertainty, which reduce incentives for capacity expansion.

How do weak revenues affect fiscal policy choices ?

They force the government to choose between higher borrowing, which can raise interest rates, or cutting expenditure, which may slow growth.

What is the key challenge for Budget 2026–27 ?

Balancing growth revival, fiscal sustainability, and private investment stimulation in a constrained macroeconomic environment.

Centre’s Health Spending Paradox: Rising State Outlays, Shrinking Union Commitment

Prelims: (Social Issues + CA)
Mains: (GS 2 – Health, Welfare, Governance; GS 3 – Fiscal Policy, Human Development)

Why in News ?

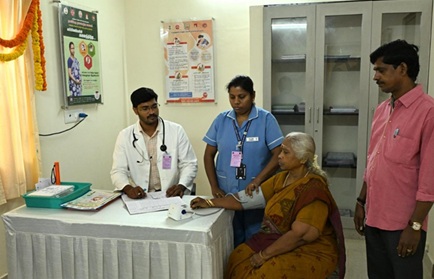
Recent data show that while States have steadily increased health expenditure, the Union government’s health spending as a share of GDP has declined in the post-pandemic period. This divergence has raised concerns about the Centre’s fiscal prioritisation of health, especially in the context of national commitments to strengthen public healthcare and reduce out-of-pocket expenditure.

Significance of the Issue

  • Public Health Outcomes: Central investment plays a critical role in financing national programmes, disease control, and health infrastructure. Declining Union spending risks weakening frontline healthcare delivery.
  • Fiscal Federalism: Although health is primarily a State subject, States depend heavily on Union transfers. Reduced Central spending can strain State finances and widen regional disparities.
  • Equity and Affordability: Lower public spending increases households’ out-of-pocket expenditure, exacerbating inequality and pushing vulnerable populations into poverty.
  • Global Commitments: Insufficient investment undermines India’s progress towards Universal Health Coverage (UHC) and the Sustainable Development Goals (SDGs) related to health.

Key Components and Takeaways

1. Background: Health Financing Commitments in India

  • Policy Commitments: The National Health Policy (NHP), 2017 committed to increasing total public health expenditure from 1.15% of GDP to 2.5% by 2025.
  • Role of the Union Government: A key pillar of this commitment was enhancing the Union government’s contribution to 40% of total public health spending.
  • Shortfall in Achievement: As of 2025–26, India remains significantly below these targets, raising concerns about whether health has been accorded adequate fiscal priority in national budgeting.

2. Trends in Public Health Spending in India

  • Among the Lowest Globally: India’s public health expenditure remains among the lowest in the world.
  • International Comparisons: Countries such as Bhutan, Sri Lanka, Thailand, and Malaysia spend several times more per capita on health. Even among BRICS nations, India’s per capita public health spending is markedly lower.
  • Pandemic-Driven Spike: During the COVID-19 pandemic, public health spending as a share of GDP rose temporarily.
  • State-Led Increase: However, this increase was driven largely by State governments, not by sustained expansion in Union government allocations.

3. Union Government Health Spending: Declining Priority

RBI Data Trends: According to Reserve Bank of India data, the Union government’s health expenditure declined from:

  • 0.37% of GDP in 2020–21
    to
  • 0.29% in 2025–26 (Budget Estimates).

Real-Term Decline: In real terms, the 2025–26 health allocation is 4.7% lower than actual spending in 2020–21 after adjusting for inflation.

Falling Budget Share: The share of health in the total Union Budget has also declined from 2.26% to 2.05%, signalling relative de-prioritisation.

Post-Pandemic Retrenchment: This indicates that the modest prioritisation of health during the pandemic has not been sustained in subsequent fiscal years.

4. State Governments Driving Health Expenditure Growth

  • Consistent Increase by States: States and Union Territories have increased health spending steadily since 2017–18.
  • GDP Share Rise: State health expenditure rose from 0.67% of GDP (2017–18) to 1.1% (2025–26).
  • Budget Share Growth: The share of health in State budgets increased from 5% to 5.6%.
  • Structural Imbalance: Despite health being a State subject, States rely heavily on Union transfers. Reduced Central spending directly affects frontline healthcare delivery, particularly in poorer States with limited fiscal capacity.

5. Health and Education Cess: Limited Impact on Health Budgets

  • Purpose of the Cess: The Health and Education Cess (HEC), introduced in 2018–19 at 4% of taxable income, was intended to augment health spending.
  • Utilisation Gap: In practice, cess collections have largely been absorbed into general revenues rather than earmarked for health.
  • FY 2023–24 Data: Only about one-fourth of ₹71,180 crore collected through HEC was allocated to health.
  • Real-Term Decline Excluding Cess: Excluding cess contributions, the Union government’s health spending declined by 22.5% in real terms between 2020–21 and 2023–24.

6. Cuts in Centrally Sponsored Health Schemes

Declining Transfers to States: The share of Union spending transferred to States through Centrally Sponsored Schemes (CSS) fell from:

  • 75.9% in 2014–15
    to
  • about 43% in 2024–25.

Impact on National Health Mission (NHM): Key schemes such as the National Health Mission, central to strengthening rural and urban health infrastructure since 2005, have seen stagnation or real-term funding declines.

Real-Term Reduction: During the second tenure of the NDA government, NHM spending declined by 5.5% annually in real terms, weakening public health system capacity.

7. Implications for Public Health Outcomes

  • Rising Out-of-Pocket Expenditure: Lower public investment increases household spending on health, raising the risk of medical impoverishment.
  • Strain on State Finances: States—especially poorer ones—face greater fiscal pressure to fund health services without adequate Central support.
  • Weakened Preventive and Primary Care: Cuts in centrally sponsored schemes undermine primary healthcare, disease prevention, and early intervention systems.
  • Reduced Emergency Preparedness: Lower sustained investment weakens readiness for future health crises and pandemics.
  • Threat to UHC and SDGs: These trends undermine India’s ability to achieve Universal Health Coverage and meet SDG targets related to health and well-being.

Challenges and Way Forward

  • Reaffirm Fiscal Commitment to Health: Align Union health spending with NHP targets by steadily increasing allocations towards 2.5% of GDP.
  • Ring-Fence Health Cess Funds: Ensure transparent and mandatory allocation of Health and Education Cess revenues to the health sector. 
  • Strengthen Centrally Sponsored Schemes: Restore real-term funding for NHM and other flagship programmes critical to primary and preventive healthcare.
  • Enhance Centre–State Coordination: Adopt cooperative federalism approaches to align Union transfers with State health priorities and needs.
  • Focus on Preventive and Primary Care: Prioritise investments in primary healthcare infrastructure, human resources, and disease surveillance to reduce long-term healthcare costs.

FAQs

1. What is the National Health Policy (2017) target for public health spending ?

It aims to raise total public health expenditure to 2.5% of GDP by 2025, with the Union government contributing about 40% of the total.

2. How has Union government health spending changed post-pandemic ?

It declined from 0.37% of GDP in 2020–21 to 0.29% in 2025–26, indicating reduced fiscal priority.

3. Why are States increasing health spending while the Centre is reducing it ?

States are compensating for rising healthcare needs and reduced Central transfers, despite having limited fiscal capacity.

4. Has the Health and Education Cess significantly boosted health budgets ?

No. A large share of cess collections has been absorbed into general revenues, with only about one-fourth allocated to health.

5. What are the risks of declining Central health spending ?

Higher out-of-pocket expenditure, strained State finances, weakened primary healthcare, and reduced preparedness for future health emergencies.

India’s Solid Waste Reform 2026: From Landfills to Source-Level Sustainability

Prelims: (Environment & Ecology + CA)
Mains: (GS 3 – Environment, Climate Change, Urbanisation; GS 2 – Governance, Local Bodies)

Why in News ?

The Union government has notified the Solid Waste Management (SWM) Rules, 2026, making source-level processing of waste mandatory for bulk waste generators and local bodies across India. The rules mark a major shift in India’s urban environmental governance by strengthening accountability, reducing landfill dependence, and operationalising the circular economy framework.

Significance of the Issue

  • Urban Environmental Sustainability: India’s cities are struggling with mounting waste volumes, environmental degradation, and public health risks. The new framework seeks to reverse landfill-centric practices.
  • Governance and Accountability: The rules transfer greater responsibility to waste generators, improving compliance and reducing the fiscal and operational burden on urban local bodies (ULBs).
  • Climate and Resource Efficiency: By prioritising waste reduction, recycling, and recovery, the framework aligns with India’s climate commitments and resource efficiency goals.
  • Public Health and Urban Liveability: Improved segregation and processing reduce groundwater contamination, air pollution, and disease risks linked to unmanaged waste.

Key Components and Takeaways

1. Solid Waste Management in India: Status and Challenges

  • Rising Waste Generation: India generates approximately 1.85 lakh tonnes of solid waste daily, driven by rapid urbanisation, population growth, and changing consumption patterns.
  • Disproportionate Contribution by Bulk Generators: Nearly 30–40% of waste originates from bulk generators such as residential societies, commercial complexes, institutions, and government buildings.
  • Lagging Processing Capacity: Despite improvements in door-to-door collection and segregation under initiatives like Swachh Bharat Mission (Urban), waste processing has not kept pace with generation.
  • Landfill Dependence and Environmental Risks: A large share of collected waste continues to be dumped in landfills, leading to land degradation, groundwater contamination, air pollution, and health hazards.
  • Poor Segregation at Source: Inadequate segregation remains the most persistent bottleneck, increasing downstream costs and reducing recycling efficiency.

2. Regulatory Framework for Solid Waste Management

Legal Basis: India’s waste governance is guided by rules framed under the Environment (Protection) Act, 1986.

SWM Rules, 2016 – A Paradigm Shift: The 2016 rules marked a move from landfill-centric disposal to scientific waste management, emphasising:

  • Mandatory segregation at source
  • Responsibilities of ULBs for collection and processing
  • Inclusion of bulk waste generators
  • Promotion of composting, biomethanation, and recycling

Implementation Gaps: Weak enforcement, limited institutional capacity of ULBs, and unclear accountability mechanisms diluted the impact of these provisions.

Need for Reform: These regulatory shortcomings prompted the formulation of the SWM Rules, 2026, replacing the decade-old framework.

3. News Summary: Solid Waste Management Rules, 2026

Stricter Compliance Regime: Notified by the Ministry of Environment, Forest and Climate Change, the rules come into effect from April 1, introducing a more enforceable and generator-focused framework.

Mandatory Source-Level Processing: The most significant reform is compulsory waste processing at source by bulk waste generators, who account for nearly one-third of urban solid waste.

4. Core Principles of the New SWM Framework

Waste Hierarchy as the Guiding Principle: The framework prioritises:

  1. Waste prevention and reduction
  2. Reuse
  3. Recycling
  4. Recovery of energy
  5. Disposal as a last resort

Restricting Landfill Use: Landfills are to be used only for non-recyclable, non-recoverable, and inert waste, reinforcing the transition towards a circular economy.

Economic Disincentives for Dumping: Higher landfill fees for unsegregated waste aim to discourage dumping and incentivise source-level processing.

5. Expanded Scope of Bulk Waste Generators

Entities classified as bulk waste generators include:

  • Buildings with a floor area of 20,000 sq. m. or more
  • Facilities consuming 40,000 litres of water per day or more
  • Entities generating 100 kg or more of waste per day

This covers:

  • Residential societies
  • Universities and hostels
  • Commercial establishments
  • Central and State government institutions

This expansion significantly broadens regulatory coverage.

6. Mandatory Segregation Norms

The rules prescribe four mandatory waste streams:

  • Wet waste
  • Dry waste
  • Sanitary waste
  • Special care waste (e.g., batteries, tube lights, e-waste)

This detailed categorisation aims to:

  • Improve recycling efficiency
  • Reduce contamination
  • Enable safer handling of hazardous components

7. Extended Bulk Waste Generator Responsibility (EBWGR)

Bulk waste generators must:

  • Process wet waste on-site wherever feasible
  • Obtain an EBWGR certificate if on-site processing is not possible
  • Ensure environmentally sound collection, transport, and processing of all waste streams

Digital Monitoring: A centralised online portal will enable real-time tracking, compliance monitoring, and enforcement.

8. New Powers for Local Bodies

Tourist Waste Management: Local authorities in hilly and island regions are empowered to:

  • Levy user fees on tourists for waste management
  • Regulate visitor numbers based on local waste-handling capacity

This recognises ecological fragility and promotes sustainable tourism.

9. Significance of the New Rules

  • Shifting Responsibility to Generators: The 2026 Rules shift the primary burden of waste management from ULBs to waste generators, enhancing accountability.
  • Reducing Municipal Fiscal Stress: By mandating source-level processing, the framework lowers the financial and operational load on municipalities.
  • Boosting Processing Rates: Targeting bulk generators directly is expected to significantly improve waste processing outcomes and reduce landfill dependence.
  • Advancing Circular Economy Goals: The framework integrates environmental protection, resource efficiency, and climate action into urban governance.

Challenges and Way Forward

  • Institutional Capacity Building: ULBs and regulators must be strengthened with technical expertise, infrastructure, and enforcement tools.
  • Behavioural Change and Compliance: Public awareness campaigns and stakeholder engagement are needed to ensure effective segregation and on-site processing.
  • Monitoring and Enforcement: The digital portal must be robust, transparent, and interoperable with State and municipal systems.
  • Support for Smaller Generators: Technical and financial support mechanisms are needed for smaller bulk generators to comply with processing norms.
  • Integrating Informal Sector: Waste pickers and informal recyclers should be integrated into formal systems to enhance livelihoods and recycling efficiency.

FAQs

1. What is the most significant change introduced by the SWM Rules, 2026 ?

Mandatory processing of waste at source by bulk waste generators, shifting responsibility away from urban local bodies.

2. Who qualifies as a bulk waste generator under the new rules ?

Entities generating 100 kg or more waste daily, buildings over 20,000 sq. m., or facilities consuming over 40,000 litres of water per day.

3. What waste streams must be segregated under the new framework ?

Wet waste, dry waste, sanitary waste, and special care waste (such as batteries and e-waste).

4. How do the new rules promote a circular economy ?

By prioritising waste reduction, reuse, recycling, and recovery, and restricting landfill use to residual, inert waste.

5. What special powers are given to local bodies in hilly and island regions ?

They can levy tourist waste management fees and regulate visitor numbers based on local waste-handling capacity.

India’s Consumption Conundrum: Spending Growth Without Strong Wage Momentum

Prelims: (Economy + CA)
Mains: (GS 3 – Economic Growth, Employment, Inflation, Fiscal Policy; GS 2 – Governance, Public Policy)

Why in News ?

As the Union Budget 2026–27 approaches, policy focus is shifting away from short-term consumer relief measures towards other growth drivers. This makes it timely to assess whether household consumption—despite income tax cuts and GST rationalisation—has genuinely strengthened, or whether underlying wage and income weaknesses continue to constrain demand.

Significance of the Issue

  • Sustaining Economic Growth: Private consumption accounts for nearly 60% of India’s GDP. Any weakness in household spending directly threatens overall growth momentum.
  • Policy Effectiveness: Evaluating whether tax cuts and price relief translate into durable consumption growth is essential for evidence-based fiscal policymaking.
  • Labour Market Health: Wage growth trends provide insight into job quality, income security, and the inclusiveness of economic recovery.
  • Financial Stability: Rising household debt to sustain consumption raises concerns about long-term financial resilience and credit sustainability.

Key Components and Takeaways

1. Policy Push to Support Consumption

  • Tax and Price Relief Measures: In 2025–26, the government cut income tax rates under the new regime and undertook long-awaited GST rate rationalisation in September to lower prices and stimulate demand.
  • Short-Term Demand Boost: Post-GST cuts, demand for consumer durables—especially vehicles—rose. TransUnion CIBIL data showed consumer durable loan demand during the Dussehra–Diwali period increased about 1.5 times year-on-year, reflecting renewed consumer confidence.
  • Inflation Decline: Lower taxes contributed to a sharp fall in headline retail inflation to a record 0.25% in October. However, not all tax cuts appear to have been fully passed on to consumers.
  • Possibility of Pent-Up Demand: Some of the demand surge may be temporary, as households that postponed purchases earlier may have front-loaded spending once prices fell.

2. Consumer Confidence Tells a Mixed Story

  • Overall Sentiment Improvement: The RBI’s Consumer Confidence Survey (November 1–10) showed an improvement in overall sentiment for both rural and urban households.
  • Rural Stress Signals: Rural households reported worsening perceptions of current income and spending, indicating continued vulnerability.
  • Urban Moderation: Urban households saw a slight improvement in income perceptions but reported weaker current spending.
  • Underlying Concern: Despite supportive policy measures and favourable headline indicators, income and spending perceptions remain fragile—especially in rural areas—pointing to uneven and vulnerable consumption recovery.

3. Inflation-Led Wage Gains Mask Underlying Weakness

  • Rural Wage Trends: Real rural wages rose to 4.1% in the first quarter of 2025–26 after stagnating for nearly three years. This rebound was largely driven by falling rural CPI inflation, which dropped sharply to 2.4%.
  • Nominal Wage Growth: Nominal rural wage growth stood at 6.5%, the highest since mid-2023, indicating that sustained consumption will depend on continued wage growth rather than just low inflation.
  • Risk of Reversal: If inflation rises without corresponding nominal wage increases, real wage gains could reverse, weakening future demand.

4. India’s Wage Growth: Inflation Is Doing the Heavy Lifting

  • Urban Wage Indicators: Urban wage trends are often measured through staff costs of listed companies. RBI data on over 3,000 non-financial firms showed real urban wage growth rose to 5.7% in July–September 2025—the highest in over two years.
  • Inflation-Driven Gains: This improvement was primarily due to low inflation (2.1%), not strong pay hikes.
  • Flat Nominal Growth: Nominal urban wage growth remained at 7.8%, largely unchanged since mid-2023.
  • Core Issue: Across both rural and urban sectors, recent real wage gains are inflation-driven rather than wage-driven. To sustain consumption as inflation rises, nominal wages must accelerate.

5. Borrow to Spend: Rising Household Debt Clouds Demand Outlook

  • Credit Growth and RBI Intervention: Personal loan growth has picked up, following the RBI’s November 2023 measures to rein in retail lending, especially unsecured loans—highlighting concerns about credit-fuelled consumption sustainability.
  • Household Balance Sheet Stress: Household financial health weakened post-pandemic as savings were used to absorb income shocks:
    • Financial liabilities rose from 3.9% of GDP (2019–20) to 6.2% (2023–24) before easing to 4.7% (2024–25).
    • Net financial assets fell to a multi-decade low of 4.9% of GDP (2022–23), recovering modestly to 6% (2024–25).

Debt Rising Faster Than Income: Between FY09 and FY23:

  • Industrial wages grew 1.9 times,
  • Real personal bank debt rose 2.9 times, reaching 3.6 times by FY25.

This indicates a growing household debt burden relative to income.

Impact on Investment: With households increasingly borrowing to sustain spending and long-term demand outlook uncertain, private investment remains subdued, as businesses hesitate to expand capacity.

6. Limited Budget Room to Boost Consumption

  • Fiscal Constraints: Economists believe the Union Budget offers limited fiscal space for direct consumption-boosting measures.
  • Monetary Policy Transmission: Support is expected to continue as the RBI’s 125 basis points of rate cuts in 2025 work their way through the economy.
  • Policy Focus Shift: With inflation expected to remain benign, the Budget is likely to:
    • Prioritise capital expenditure,
    • Support labour-intensive export sectors affected by US tariffs,
    • Maintain fiscal discipline to preserve buffers for future economic shocks.

Challenges and Way Forward

  • Boosting Nominal Wage Growth: Policies must focus on productivity, skill development, and job quality to ensure wages rise alongside inflation.
  • Strengthening Rural Incomes: Targeted rural employment schemes, agricultural income diversification, and non-farm job creation are crucial.
  • Managing Household Debt: Strengthen credit regulation, promote responsible lending, and enhance financial literacy to prevent over-leveraging.
  • Encouraging Private Investment: Stable demand outlook, policy certainty, and infrastructure investment can crowd in private sector investment.
  • Balancing Fiscal Prudence and Growth: Maintain fiscal discipline while preserving flexibility for counter-cyclical intervention if consumption weakens.

FAQs

1. Why is India’s consumption growth considered fragile ?

Because recent spending increases are driven by tax cuts, low inflation, and borrowing rather than strong and sustained wage growth.

2. What explains the recent rise in real wages ?

Primarily falling inflation, not significant increases in nominal wages.

3. Why is rising household debt a concern ?

Because households are borrowing faster than incomes are growing, which may weaken long-term financial stability and consumption sustainability.

4. Does the Union Budget have scope to boost consumption further ?

Limited fiscal space suggests the Budget will focus more on capital expenditure and exports rather than direct consumption stimulus.

5. What is needed to sustain long-term consumption growth ?

Strong nominal wage growth, job creation, productivity gains, and improved income security across rural and urban sectors.

« »
  • SUN
  • MON
  • TUE
  • WED
  • THU
  • FRI
  • SAT
Have any Query?

Our support team will be happy to assist you!

OR
X