NITI Aayog's India S&T Scoreboard 2026

Prelims & Mains: General Studies Paper II (Education and Governance), General Studies Paper III (Science and Technology, Research and Development, Innovation and Economic Development)
Keywords: NITI Aayog, India Science and Technology Scoreboard 2026, Research Publications, Scientific Research in India, State-wise Research Performance, Patent Applications, Research and Development, Innovation Ecosystem, Competitive Federalism, Viksit Bharat 2047

Why in News ?

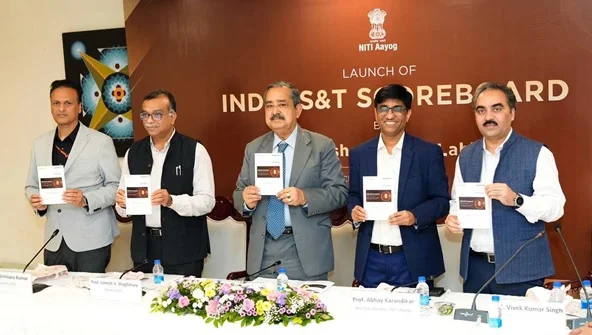
  • On 3 November 2026, NITI Aayog launched the India Science and Technology (S&T) Scoreboard, an interactive platform assessing scientific research and innovation across Indian States and Union Territories.
  • According to the scoreboard, nearly 70% of India's research publications in FY 2024–25 were associated with five leading States/UTs: Tamil Nadu, Uttar Pradesh, Maharashtra, Karnataka and Delhi.

Key Facts at a Glance

Particular

Details

Initiative

India Science and Technology (S&T) Scoreboard

Launched by

NITI Aayog

Launch date

3 November 2026

Location

New Delhi

Launched by

Ashok Kumar Lahiri, Vice Chairman, NITI Aayog

Reference year

FY 2024–25

Research publications in India

2,23,005

Patent applications

62,934

Leading state in publications

Tamil Nadu

Leading state in patent applications

Tamil Nadu

Geographical coverage

36 States and Union Territories

Research publication data source

Web of Science / InCites

Patent data source

Clarivate DWPI

Main objective

Evidence-based policymaking and state-wise benchmarking

Official portal

India S&T Scoreboard

State-wise Research Publications in India (2024–25)

The scoreboard reveals substantial differences in research publication output across Indian States and Union Territories.

Rank

State/UT

Research Publications

1

Tamil Nadu

44,611

2

Uttar Pradesh

29,298

3

Maharashtra

28,947

4

Karnataka

27,970

5

Delhi

24,417

6

West Bengal

18,280

7

Punjab

15,565

8

Telangana

15,253

9

Uttarakhand

11,169

10

Gujarat

10,503

Key Findings

  • Research concentration: The top five States/UTs account for approximately 69.6% of the national publication count when their reported figures are compared with India's total.
  • Tamil Nadu's leadership: Tamil Nadu contributed 44,611 research publications, the highest among all states.
  • Uttar Pradesh's performance: Uttar Pradesh ranked second in research publications with 29,298.
  • Regional disparities: Several smaller and less industrialised states reported comparatively fewer research publications.
  • Southern representation: Tamil Nadu and Karnataka were the two southern states among the top five, while Telangana ranked eighth.

Patent Applications: State-wise Performance

Patent applications serve as an important indicator of technological invention and potential commercial innovation.

Rank

State

Patent Applications (2024–25)

1

Tamil Nadu

16,048

2

Maharashtra

8,567

3

Karnataka

8,413

4

Uttar Pradesh

5,375

5

Telangana

5,200

Major Observations

  • Tamil Nadu leads in both scientific publications and patent applications.
  • Maharashtra and Karnataka occupy the second and third positions, respectively, in patent applications.
  • Uttar Pradesh ranks second in research publications but fourth in patent applications.
  • Research publication rankings and patent rankings measure different dimensions of scientific performance.
  • A high number of patent applications does not necessarily indicate an equally high number of granted or commercially utilised patents.

About the India Science and Technology Scoreboard

The India S&T Scoreboard is an interactive data platform developed by NITI Aayog to evaluate and compare the research and innovation performance of Indian States and Union Territories.

Major Components

Component

Indicators

Research ecosystem

Universities, higher education institutions and R&D institutions

Scientific output

Research publications and their trends

Innovation output

Patent applications

Research quality

Citation impact and journal quality

Collaboration

International research collaborations

Innovation infrastructure

Deep-tech startups and incubators

Policy assessment

State-level S&T policies and best practices

Key Features

  • Provides comparable state-wise scientific research and innovation data.
  • Covers research publication trends from FY 2021–22 to FY 2024–25.
  • Facilitates comparison among States and Union Territories.
  • Examines research across academia, government R&D laboratories and industry.
  • Supports evidence-based planning, policy formulation and identification of regional research gaps.

India's Scientific Research Ecosystem: Major Indicators

According to the NITI Aayog scoreboard, the national research ecosystem includes the following indicators.

Indicator

Reported Figure

Research publications (FY 2024–25)

2,23,005

Patent applications (FY 2024–25)

62,934

Higher education institutions in dashboard

1,260

R&D institutions

356

Deep-tech startup records

38,553

Atal Tinkering Labs

7,246

Incubators under listed programmes

390

Research Quality and Global Collaboration

Research output is assessed not only through the number of published papers but also through their quality, influence and international collaboration.

Research Quality Indicator

India (FY 2024–25)

Category Normalized Citation Impact (CNCI)

0.89

Publications among globally top 10% cited documents

8.5%

Publications in Q1 journals

28.5%

Internationally collaborative publications

29.9%

  • Citation impact: India's CNCI of 0.89 is below the world-average benchmark of 1.00.
  • Research quality: Publications in top-quartile journals provide an indication of journal standing.
  • Global collaboration: Nearly 30% of publications involved international collaboration.
  • Research visibility: Improving the quality and impact of publications remains essential alongside increasing their quantity.

Significance of the Findings

  1. Evidence-based Science Policy: The scoreboard enables governments to use comparable research and innovation data for policy formulation and resource allocation.
  2. Strengthening Cooperative and Competitive Federalism: States can identify successful policies, compare performance and adopt effective research-development practices from one another.
  3. Promoting Regional Development: Identification of geographical disparities can support targeted investment in research institutions, universities and innovation infrastructure in underrepresented regions.
  4. Enhancing India's Technological Competitiveness: Stronger scientific research and patent ecosystems can contribute to indigenous technology development, industrial competitiveness and technological self-reliance.
  5. Supporting Viksit Bharat 2047: Expanding high-quality scientific research across states can strengthen India's long-term economic productivity, innovation capacity and development prospects.

Challenges Facing India's Research and Innovation Ecosystem

  • Uneven regional distribution: Scientific research output remains concentrated in a limited number of States and Union Territories.
  • Research funding disparities: Unequal access to funding can affect the development of research infrastructure.
  • Institutional capacity gaps: Many institutions face limitations in advanced laboratories, equipment and specialised human resources.
  • Limited industry-academia collaboration: Weak linkages may hinder the conversion of academic research into commercially viable innovations.
  • Research quality concerns: Increasing publication numbers does not automatically ensure improvements in citation impact and scientific relevance.
  • Commercialisation barriers: Patent filing, technology transfer and industrial application involve distinct challenges.

Way Forward

  1. Strengthen State Universities: Expand research infrastructure, laboratories and academic research support in state public universities.
  2. Increase R&D Investment: Promote sustained research funding through public investment, private participation and competitive grants.
  3. Promote Regional Research Clusters: Establish collaborative networks among universities, research institutions, startups and industries.
  4. Improve Research Quality: Encourage high-impact, interdisciplinary and internationally collaborative research.
  5. Strengthen Technology Transfer: Support patent facilitation, incubation, licensing and commercialisation.
  6. Use Scoreboard Data for Policymaking: States should regularly assess performance and formulate targeted science and technology policies.

Conclusion

The India Science and Technology Scoreboard 2026 highlights both India's expanding scientific research ecosystem and the uneven geographical distribution of its research output. With nearly 70% of reported research publications concentrated in five leading States/UTs, strengthening scientific capabilities across other regions is essential. Greater investment in research infrastructure, institutional capacity, innovation and collaboration can help India develop a more inclusive and competitive knowledge economy.

Prelims Practice Question

Q. With reference to the India Science and Technology (S&T) Scoreboard 2026, consider the following statements:

  1. The scoreboard was launched by NITI Aayog.
  2. Tamil Nadu ranked first in research publications during FY 2024–25.
  3. Karnataka ranked second in research publications during FY 2024–25.

Which of the statements given above is/are correct?

(a) 1 and 2 only

(b) 2 and 3 only

(c) 1 and 3 only

(d) 1, 2 and 3

Mains Practice Question

"India's scientific research output remains geographically concentrated despite the expansion of its innovation ecosystem." Examine the challenges arising from regional disparities in research and suggest measures to ensure balanced scientific development across Indian states.

FAQs

Q1. What is the India Science and Technology Scoreboard 2026?

It is an interactive platform launched by NITI Aayog to evaluate and compare scientific research, innovation, patent applications and related indicators across Indian States and Union Territories.

Q2. Which state ranked first in research publications in FY 2024–25?

Tamil Nadu ranked first with 44,611 research publications.

Q3. Which state ranked second in research publications?

Uttar Pradesh ranked second with 29,298 research publications.

Q4. Which state recorded the highest number of patent applications?

Tamil Nadu, with 16,048 patent applications in FY 2024–25.

Q5. What is the main objective of the S&T Scoreboard?

Its primary objective is to facilitate evidence-based policymaking, identify research gaps and promote comparative assessment of scientific and technological performance across states.