
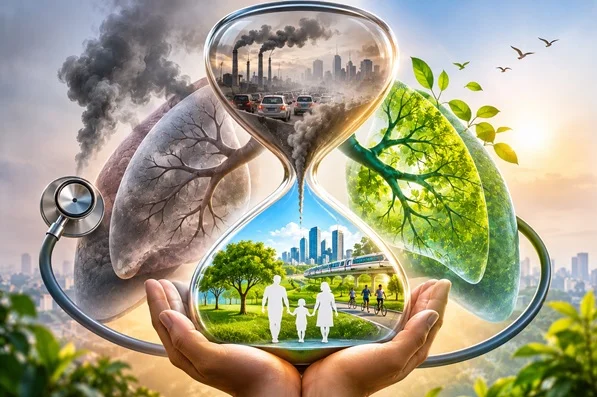
A new study by researchers from the University of Cambridge has revealed that more than 9 million premature deaths could potentially be prevented or postponed every year in low- and middle-income countries if they met the World Health Organization's (WHO) recommended air quality guidelines.
|
Particular |
Information |
|
Research institution |
University of Cambridge |
|
Journal |
Environment International |
|
Publication date |
10 November 2026 |
|
Countries studied |
136 low- and middle-income countries |
|
Major pollutants |
PM2.5 and NO₂ |
|
Potential deaths prevented through PM2.5 guideline |
9.4 million annually |
|
Potential deaths prevented through NO₂ guideline |
1.1 million annually |
|
WHO guideline year |
2021 |
|
Annual PM2.5 guideline |
5 µg/m³ |
|
Type |
Meaning |
Examples |
|
Outdoor / Ambient air pollution |
Pollution present in the surrounding outdoor atmosphere |
Vehicle emissions, industrial smoke, construction dust |
|
Indoor / Household air pollution |
Pollution inside homes and enclosed spaces |
Biomass cooking smoke, tobacco smoke, poorly ventilated fuel combustion |
|
Source |
Examples |
|
Vehicles |
Diesel and petrol exhaust |
|
Industries |
Industrial combustion and emissions |
|
Power plants |
Burning coal and other fossil fuels |
|
Construction |
Dust and building activities |
|
Household activities |
Wood and coal burning |
|
Agricultural activities |
Crop residue burning |
|
Secondary formation |
Chemical reactions involving gases such as sulphur dioxide and nitrogen oxides |
|
Pollutant |
Annual average guideline |
24-hour guideline |
|
PM2.5 |
5 µg/m³ |
15 µg/m³ |
|
PM10 |
15 µg/m³ |
45 µg/m³ |
|
Nitrogen dioxide (NO₂) |
10 µg/m³ |
25 µg/m³ |
|
Disease / Condition |
How air pollution affects the body |
|
Coronary Heart Disease |
Increases inflammation and cardiovascular stress |
|
Stroke |
Damages blood vessels and increases cardiovascular risk |
|
Chronic Obstructive Pulmonary Disease (COPD) |
Causes airway inflammation and damages lung function |
|
Asthma |
Triggers airway irritation and breathing difficulties |
|
Dementia |
Long-term exposure is associated with increased neurological disease risk |
|
Lung Cancer |
Certain air pollutants contain carcinogenic substances |
|
Respiratory infections |
Weakens respiratory defence mechanisms |
|
Disease |
Potential reduction in new cases annually |
|
Coronary Heart Disease |
7.3 million |
|
Chronic Obstructive Pulmonary Disease |
2.8 million |
|
Stroke |
2.3 million |
|
Dementia |
1.1 million |
|
Factor |
Explanation |
|
Rapid urbanisation |
Increasing population and demand for transport and housing |
|
Industrialisation |
Rising industrial and energy-related emissions |
|
Fossil-fuel dependence |
Greater reliance on coal, diesel and other polluting fuels |
|
Vehicle growth |
Increasing traffic and exhaust emissions |
|
Weak enforcement |
Gaps in implementation of pollution-control regulations |
|
Household pollution |
Continued use of polluting cooking fuels |
|
Infrastructure gaps |
Limited public transport and inadequate waste management |
|
Source |
Contribution to pollution |
|
Transport |
Vehicle exhaust and road dust |
|
Industries |
Industrial emissions |
|
Thermal power plants |
Coal combustion |
|
Construction |
Dust and particulate emissions |
|
Agriculture |
Crop-residue burning and other activities |
|
Household fuel use |
Smoke from biomass and solid fuels |
|
Waste burning |
Release of harmful gases and particles |
|
Initiative |
Ministry / Authority |
Main objective |
|
National Clean Air Programme (NCAP) |
Ministry of Environment, Forest and Climate Change |
Improve air quality in identified cities |
|
Graded Response Action Plan (GRAP) |
Commission for Air Quality Management (CAQM) and relevant authorities |
Introduce emergency measures during severe pollution |
|
Bharat Stage VI (BS-VI) |
Ministry of Road Transport and Highways |
Reduce vehicular emissions through stricter standards |
|
Pradhan Mantri Ujjwala Yojana (PMUY) |
Ministry of Petroleum and Natural Gas |
Promote LPG connections and reduce household smoke |
|
FAME India Scheme |
Ministry of Heavy Industries |
Promote electric and hybrid vehicles |
|
PM-eBus Sewa |
Ministry of Housing and Urban Affairs |
Expand electric public transport |
|
Swachh Bharat Mission-Urban 2.0 |
Ministry of Housing and Urban Affairs |
Improve solid-waste management and prevent open waste burning |
|
Organisation / Initiative |
Role |
|
WHO |
Develops health-based air quality guidelines |
|
United Nations Environment Programme (UNEP) |
Supports global environmental governance |
|
Climate and Clean Air Coalition (CCAC) |
Promotes action against short-lived climate pollutants |
|
Convention on Long-range Transboundary Air Pollution (CLRTAP) |
Promotes international cooperation to reduce transboundary air pollution |
|
Sustainable Development Goals |
Encourage clean energy, sustainable cities and better health |
Prelims MCQsQ. The WHO's 2021 annual guideline value for PM2.5 is: (a) 10 µg/m³ (b) 15 µg/m³ (c) 5 µg/m³ (d) 40 µg/m³ Mains Practice QuestionQ. Discuss the recent University of Cambridge study on the potential benefits of achieving WHO air quality guidelines." |
Which organisation conducted the study?Researchers from the University of Cambridge, UK. What is PM2.5?Fine particulate matter with a diameter of 2.5 micrometres or less. What is the WHO annual guideline for PM2.5?5 µg/m³ under the 2021 guidelines. What is the WHO annual guideline for NO₂?10 µg/m³ under the 2021 guidelines. What is NCAP?The National Clean Air Programme, launched in January 2019 to improve air quality in identified Indian cities. |