Current Affairs for 04 November 2026

NITI Aayog's India S&T Scoreboard 2026

Prelims & Mains: General Studies Paper II (Education and Governance), General Studies Paper III (Science and Technology, Research and Development, Innovation and Economic Development)
Keywords: NITI Aayog, India Science and Technology Scoreboard 2026, Research Publications, Scientific Research in India, State-wise Research Performance, Patent Applications, Research and Development, Innovation Ecosystem, Competitive Federalism, Viksit Bharat 2047

Why in News ?

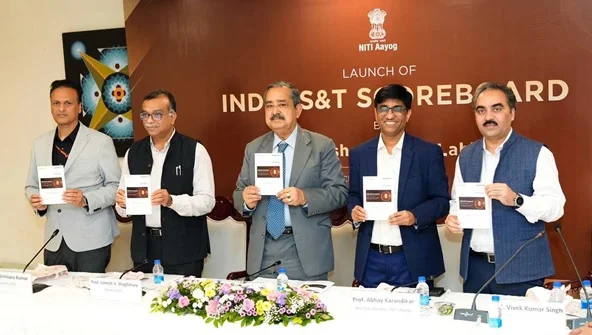
  • On 3 November 2026, NITI Aayog launched the India Science and Technology (S&T) Scoreboard, an interactive platform assessing scientific research and innovation across Indian States and Union Territories.
  • According to the scoreboard, nearly 70% of India's research publications in FY 2024–25 were associated with five leading States/UTs: Tamil Nadu, Uttar Pradesh, Maharashtra, Karnataka and Delhi.

Key Facts at a Glance

Particular

Details

Initiative

India Science and Technology (S&T) Scoreboard

Launched by

NITI Aayog

Launch date

3 November 2026

Location

New Delhi

Launched by

Ashok Kumar Lahiri, Vice Chairman, NITI Aayog

Reference year

FY 2024–25

Research publications in India

2,23,005

Patent applications

62,934

Leading state in publications

Tamil Nadu

Leading state in patent applications

Tamil Nadu

Geographical coverage

36 States and Union Territories

Research publication data source

Web of Science / InCites

Patent data source

Clarivate DWPI

Main objective

Evidence-based policymaking and state-wise benchmarking

Official portal

India S&T Scoreboard

State-wise Research Publications in India (2024–25)

The scoreboard reveals substantial differences in research publication output across Indian States and Union Territories.

Rank

State/UT

Research Publications

1

Tamil Nadu

44,611

2

Uttar Pradesh

29,298

3

Maharashtra

28,947

4

Karnataka

27,970

5

Delhi

24,417

6

West Bengal

18,280

7

Punjab

15,565

8

Telangana

15,253

9

Uttarakhand

11,169

10

Gujarat

10,503

Key Findings

  • Research concentration: The top five States/UTs account for approximately 69.6% of the national publication count when their reported figures are compared with India's total.
  • Tamil Nadu's leadership: Tamil Nadu contributed 44,611 research publications, the highest among all states.
  • Uttar Pradesh's performance: Uttar Pradesh ranked second in research publications with 29,298.
  • Regional disparities: Several smaller and less industrialised states reported comparatively fewer research publications.
  • Southern representation: Tamil Nadu and Karnataka were the two southern states among the top five, while Telangana ranked eighth.

Patent Applications: State-wise Performance

Patent applications serve as an important indicator of technological invention and potential commercial innovation.

Rank

State

Patent Applications (2024–25)

1

Tamil Nadu

16,048

2

Maharashtra

8,567

3

Karnataka

8,413

4

Uttar Pradesh

5,375

5

Telangana

5,200

Major Observations

  • Tamil Nadu leads in both scientific publications and patent applications.
  • Maharashtra and Karnataka occupy the second and third positions, respectively, in patent applications.
  • Uttar Pradesh ranks second in research publications but fourth in patent applications.
  • Research publication rankings and patent rankings measure different dimensions of scientific performance.
  • A high number of patent applications does not necessarily indicate an equally high number of granted or commercially utilised patents.

About the India Science and Technology Scoreboard

The India S&T Scoreboard is an interactive data platform developed by NITI Aayog to evaluate and compare the research and innovation performance of Indian States and Union Territories.

Major Components

Component

Indicators

Research ecosystem

Universities, higher education institutions and R&D institutions

Scientific output

Research publications and their trends

Innovation output

Patent applications

Research quality

Citation impact and journal quality

Collaboration

International research collaborations

Innovation infrastructure

Deep-tech startups and incubators

Policy assessment

State-level S&T policies and best practices

Key Features

  • Provides comparable state-wise scientific research and innovation data.
  • Covers research publication trends from FY 2021–22 to FY 2024–25.
  • Facilitates comparison among States and Union Territories.
  • Examines research across academia, government R&D laboratories and industry.
  • Supports evidence-based planning, policy formulation and identification of regional research gaps.

India's Scientific Research Ecosystem: Major Indicators

According to the NITI Aayog scoreboard, the national research ecosystem includes the following indicators.

Indicator

Reported Figure

Research publications (FY 2024–25)

2,23,005

Patent applications (FY 2024–25)

62,934

Higher education institutions in dashboard

1,260

R&D institutions

356

Deep-tech startup records

38,553

Atal Tinkering Labs

7,246

Incubators under listed programmes

390

Research Quality and Global Collaboration

Research output is assessed not only through the number of published papers but also through their quality, influence and international collaboration.

Research Quality Indicator

India (FY 2024–25)

Category Normalized Citation Impact (CNCI)

0.89

Publications among globally top 10% cited documents

8.5%

Publications in Q1 journals

28.5%

Internationally collaborative publications

29.9%

  • Citation impact: India's CNCI of 0.89 is below the world-average benchmark of 1.00.
  • Research quality: Publications in top-quartile journals provide an indication of journal standing.
  • Global collaboration: Nearly 30% of publications involved international collaboration.
  • Research visibility: Improving the quality and impact of publications remains essential alongside increasing their quantity.

Significance of the Findings

  1. Evidence-based Science Policy: The scoreboard enables governments to use comparable research and innovation data for policy formulation and resource allocation.
  2. Strengthening Cooperative and Competitive Federalism: States can identify successful policies, compare performance and adopt effective research-development practices from one another.
  3. Promoting Regional Development: Identification of geographical disparities can support targeted investment in research institutions, universities and innovation infrastructure in underrepresented regions.
  4. Enhancing India's Technological Competitiveness: Stronger scientific research and patent ecosystems can contribute to indigenous technology development, industrial competitiveness and technological self-reliance.
  5. Supporting Viksit Bharat 2047: Expanding high-quality scientific research across states can strengthen India's long-term economic productivity, innovation capacity and development prospects.

Challenges Facing India's Research and Innovation Ecosystem

  • Uneven regional distribution: Scientific research output remains concentrated in a limited number of States and Union Territories.
  • Research funding disparities: Unequal access to funding can affect the development of research infrastructure.
  • Institutional capacity gaps: Many institutions face limitations in advanced laboratories, equipment and specialised human resources.
  • Limited industry-academia collaboration: Weak linkages may hinder the conversion of academic research into commercially viable innovations.
  • Research quality concerns: Increasing publication numbers does not automatically ensure improvements in citation impact and scientific relevance.
  • Commercialisation barriers: Patent filing, technology transfer and industrial application involve distinct challenges.

Way Forward

  1. Strengthen State Universities: Expand research infrastructure, laboratories and academic research support in state public universities.
  2. Increase R&D Investment: Promote sustained research funding through public investment, private participation and competitive grants.
  3. Promote Regional Research Clusters: Establish collaborative networks among universities, research institutions, startups and industries.
  4. Improve Research Quality: Encourage high-impact, interdisciplinary and internationally collaborative research.
  5. Strengthen Technology Transfer: Support patent facilitation, incubation, licensing and commercialisation.
  6. Use Scoreboard Data for Policymaking: States should regularly assess performance and formulate targeted science and technology policies.

Conclusion

The India Science and Technology Scoreboard 2026 highlights both India's expanding scientific research ecosystem and the uneven geographical distribution of its research output. With nearly 70% of reported research publications concentrated in five leading States/UTs, strengthening scientific capabilities across other regions is essential. Greater investment in research infrastructure, institutional capacity, innovation and collaboration can help India develop a more inclusive and competitive knowledge economy.

Prelims Practice Question

Q. With reference to the India Science and Technology (S&T) Scoreboard 2026, consider the following statements:

  1. The scoreboard was launched by NITI Aayog.
  2. Tamil Nadu ranked first in research publications during FY 2024–25.
  3. Karnataka ranked second in research publications during FY 2024–25.

Which of the statements given above is/are correct?

(a) 1 and 2 only

(b) 2 and 3 only

(c) 1 and 3 only

(d) 1, 2 and 3

Mains Practice Question

"India's scientific research output remains geographically concentrated despite the expansion of its innovation ecosystem." Examine the challenges arising from regional disparities in research and suggest measures to ensure balanced scientific development across Indian states.

FAQs

Q1. What is the India Science and Technology Scoreboard 2026?

It is an interactive platform launched by NITI Aayog to evaluate and compare scientific research, innovation, patent applications and related indicators across Indian States and Union Territories.

Q2. Which state ranked first in research publications in FY 2024–25?

Tamil Nadu ranked first with 44,611 research publications.

Q3. Which state ranked second in research publications?

Uttar Pradesh ranked second with 29,298 research publications.

Q4. Which state recorded the highest number of patent applications?

Tamil Nadu, with 16,048 patent applications in FY 2024–25.

Q5. What is the main objective of the S&T Scoreboard?

Its primary objective is to facilitate evidence-based policymaking, identify research gaps and promote comparative assessment of scientific and technological performance across states.

Sikkim’s Soreng Becomes India’s First Organic Fisheries Cluster

Why in News?

  • Sikkim’s Soreng district has become India’s first notified Organic Fisheries Cluster under the Pradhan Mantri Matsya Sampada Yojana (PMMSY). The initiative aims to promote chemical-free fish farming, improve farmers’ incomes and expand market opportunities for organic fish products.
  • The Union Government has also introduced a Standard Operating Procedure (SOP) for the organic certification of fisheries in the Northeast. 
  • It will provide a structured framework for organic fish production, certification and traceability.

What Is the Organic Fisheries Cluster Initiative?

  • The initiative aims to promote environmentally sustainable fish farming by reducing the use of harmful chemicals, antibiotics and pesticides.
  • The Soreng cluster will focus on the production of three major fish varieties:
    • Amur Carp
    • Indian Major Carps
    • Trout
  • The initiative will use Sikkim’s existing organic farming ecosystem to promote organic fish production and help farmers access premium domestic and international markets.

Key Features of the Initiative

1. SOP for Organic Fisheries Certification

  • The Centre has launched an SOP to guide organic fish production and certification in the Northeastern region.
  • Its major objectives include:
    • Establishing a standard framework for organic fish production.
    • Facilitating organic certification of fisheries.
    • Ensuring traceability across the fisheries value chain.
    • Improving consumer confidence in organic fish products.
    • Helping farmers access high-value markets.

2. Fisheries Projects Worth ₹3.75 Crore

  • During his visit to Sikkim, Union Fisheries Minister Rajiv Ranjan Singh inaugurated fisheries development projects worth ₹3.75 crore.
  • These projects include infrastructure and modern production facilities such as:
    • Fish hatcheries.
    • Fish feed mills.
    • Cold storage facilities.
    • Biofloc technology.
    • Recirculatory Aquaculture Systems (RAS).
  • These facilities are expected to strengthen the fisheries value chain, from fish production to processing and marketing.

3. Support for Fish Farmers

  • During the visit, the Union Minister also inspected a live fish vending centre supported under PMMSY and interacted with members of fish farmers’ cooperative societies.
  • Other support measures included:
    • Distribution of fish feed to 15 farmers from two cooperative societies.
    • Distribution of Kisan Credit Cards (KCCs) to improve access to institutional credit.
    • Financial assistance through cheques to five farmers under the Mukhya Mantri Matsya Uthpadhan Yojana (MMMUY).

India’s Cluster-Based Fisheries Development Approach

  • The Government has notified 34 fisheries production and processing clusters across the country.
  • These clusters aim to bring different stages of fisheries development together within identified geographical areas. This includes:
    • Fish production.
    • Processing and storage.
    • Value addition.
    • Marketing and distribution.
  • Organic fisheries clusters have been notified in Sikkim and Meghalaya. The cluster-based approach is expected to improve coordination, infrastructure and market access in the fisheries sector.

Sikkim Signs MoU with ITBP to Promote Rainbow Trout

  • To strengthen market linkages, the Sikkim Government has signed a Memorandum of Understanding (MoU) with the Indo-Tibetan Border Police (ITBP) for the institutional procurement of locally produced Rainbow Trout.
  • Under this arrangement, ITBP establishments will procure Rainbow Trout from local fish farmers.
  • The agreement covers important aspects such as:
    • Quality standards.
    • Pricing arrangements.
    • Supply capacity.
    • Inspection mechanisms.
    • Delivery schedules.
  • This arrangement is expected to provide a more stable and reliable market for trout farmers in Sikkim.

Significance of the Initiative

  1. Promotion of Sustainable Fisheries: Organic fish farming will encourage environmentally responsible production practices and reduce dependence on harmful chemicals.
  2.  Higher Farmers’ Income: Access to premium domestic and export markets can improve the income opportunities of fish farmers.
  3.  Better Market Access: The SOP and ITBP procurement agreement will help strengthen certification, traceability and institutional market linkages.
  4.  Development of Fisheries Infrastructure: Investments in hatcheries, feed mills, cold storage and modern aquaculture technologies will strengthen the fisheries value chain.
  5. Promotion of Organic Agriculture and Fisheries: The initiative will build on Sikkim’s organic farming ecosystem and support the development of organic fisheries.

What Is PM Matsya Sampada Yojana (PMMSY)?

  • The Pradhan Mantri Matsya Sampada Yojana (PMMSY) is a flagship scheme of the Government of India launched in September 2020.
  • It aims to bring about a sustainable and responsible development of the fisheries sector and increase fish production, productivity and farmers’ incomes.
  • Its key objectives include:
    • Increasing fish production and productivity.
    • Strengthening fisheries infrastructure and post-harvest management.
    • Reducing post-harvest losses.
    • Improving market access and value addition.
    • Promoting the welfare of fishers and fish farmers.

Conclusion

The notification of Soreng as India’s first Organic Fisheries Cluster marks an important step towards sustainable fisheries development. By combining organic certification, modern infrastructure, farmer support and assured market linkages, the initiative can help strengthen Sikkim’s fisheries sector and create new opportunities for fish farmers.

Prelims Practice Question 

1. Consider the following statements about Soreng Organic Fisheries Cluster:

  1. Soreng is located in Sikkim.
  2. It is India’s first notified Organic Fisheries Cluster.
  3. It has been notified under the Pradhan Mantri Matsya Sampada Yojana.

Which of the statements given above is/are correct?

(a) 1 and 2 only
(b) 2 and 3 only
(c) 1 and 3 only
(d) 1, 2 and 3

Mains Practice Question

Q. Discuss the role of organic and sustainable aquaculture in strengthening India’s fisheries sector. Examine the importance of infrastructure, certification and market linkages in improving fish farmers’ incomes.

FAQs

1. Which state has India’s first notified Organic Fisheries Cluster?

Sikkim. Soreng district has been notified as India’s first Organic Fisheries Cluster.

2. Under which scheme has the Soreng Organic Fisheries Cluster been notified?

It has been notified under the Pradhan Mantri Matsya Sampada Yojana (PMMSY).

3. Which fish varieties are the focus of the Soreng cluster?

The cluster focuses on Amur Carp, Indian Major Carps and trout.

4. What is the purpose of the SOP for organic fisheries in Northeast India?

It aims to establish a framework for organic fish production, certification and traceability, while improving market access and consumer confidence.

5. What is the objective of the Sikkim Government’s MoU with ITBP?

The MoU aims to facilitate the institutional procurement of locally produced Rainbow Trout by ITBP establishments, providing a stable market for fish farmers.

Nirmala Sitharaman Releases Special Coin to Mark 250th Birth Anniversary of Muthuswamy Dikshitar

Why in News?

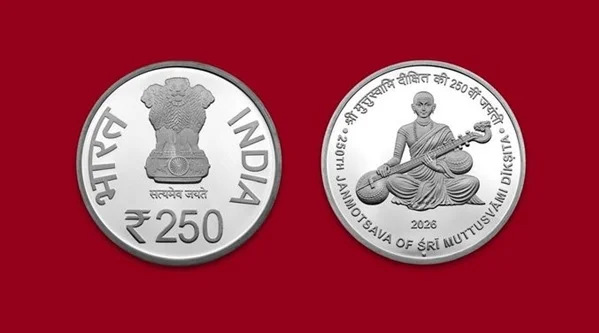
  • Union Finance Minister Nirmala Sitharaman released a ₹250 commemorative coin to mark the 250th birth anniversary of Muthuswamy Dikshitar, a renowned composer of Carnatic classical music.
  • The coin was released at Banaras Hindu University (BHU) in Varanasi. The programme was organised under the Centre of Excellence for Indian Knowledge Systems at IIT-BHU.
  • The initiative aims to recognise Muthuswamy Dikshitar’s contribution to Indian classical music and promote awareness of India’s rich cultural heritage among the younger generation.

Important points 

  • Occasion: 250th birth anniversary of Muthuswamy Dikshitar.
  • Coin released: ₹250 commemorative coin.
  • Released by: Union Finance Minister Nirmala Sitharaman.
  • Venue: Banaras Hindu University (BHU), Varanasi.
  • Organised by: Centre of Excellence for Indian Knowledge Systems, IIT-BHU.
  • Support: The initiative received support from the Bombay Stock Exchange (BSE) under its Corporate Social Responsibility (CSR) programme.

During the event, Sitharaman paid floral tribute to Pandit Madan Mohan Malaviya, the founder of BHU. She also interacted with students and schoolchildren and discussed Indian classical music, musical instruments and their cultural importance.

Significance of the Commemorative Coin

  • The ₹250 coin honours the contribution of Muthuswamy Dikshitar to Indian classical music and cultural traditions.
  • Commemorative coins are issued to mark important personalities, events and milestones. They are generally produced in limited quantities and collected as memorabilia rather than used for regular financial transactions.
  • According to the Government Mint’s website, the coin was listed for purchase at ₹6,985.

Who Was Muthuswamy Dikshitar?

  • Muthuswamy Dikshitar (1775–1835) was one of the greatest composers of Carnatic classical music. He is regarded as one of the Trinity of Carnatic Music, along with Tyagaraja and Syama Sastri.
  • Key Facts About Muthuswamy Dikshitar
    • Major Contribution: He made a significant contribution to Carnatic music through his compositions, which combine devotion, Indian philosophy and classical musical traditions.
    • Language of Compositions: Most of his compositions were written in Sanskrit.
    • Musical Works: He is believed to have composed around 450–500 musical works, many of which continue to be performed at classical music concerts.
    • Association with Varanasi: He spent a considerable period in Varanasi (Kashi), where he composed several works dedicated to temples and Hindu deities.
    • Musical Instrument: The veena was closely associated with his musical tradition and compositions.

Trinity of Carnatic Music

The Trinity of Carnatic Music refers to three renowned composers who made a lasting contribution to South Indian classical music.

  • Muthuswamy Dikshitar: Known for Sanskrit compositions that combine devotion, philosophy and classical musical elements.
  • Tyagaraja: Renowned for his devotional compositions, particularly in praise of Lord Rama.
  • Syama Sastri: Known for his devotional compositions dedicated mainly to Goddess Kamakshi.

Together, their contributions played an important role in shaping the tradition of Carnatic classical music.

Why Is the Initiative Important?

  1. Preservation of Cultural Heritage: The commemorative coin recognises the contribution of a major figure in Indian classical music.
  2. Connecting Youth with Indian Traditions: Cultural programmes help students understand India's music, literature, languages and art forms.
  3. Promotion of Indian Knowledge Systems: The initiative highlights the importance of preserving and promoting India's traditional knowledge and artistic heritage.
  4. Recognition of Varanasi’s Cultural Significance: Muthuswamy Dikshitar’s association with Kashi highlights the city’s historical importance as a centre of Indian art, music and spirituality.

Conclusion

The release of the ₹250 commemorative coin on Muthuswamy Dikshitar’s 250th birth anniversary is a tribute to his lasting contribution to Carnatic music. Such initiatives can help preserve India's classical music traditions and encourage younger generations to understand and appreciate the country's cultural heritage.

FAQs

1. Why was the ₹250 commemorative coin released?

The coin was released to mark the 250th birth anniversary of renowned Carnatic music composer Muthuswamy Dikshitar.

2. Who released the commemorative coin?

Union Finance Minister Nirmala Sitharaman released the coin.

3. Where was the commemorative coin released?

It was released at Banaras Hindu University (BHU) in Varanasi.

4. Who are the Trinity of Carnatic Music?

The Trinity of Carnatic Music comprises Muthuswamy Dikshitar, Tyagaraja and Syama Sastri.

5. Which language was primarily used in Muthuswamy Dikshitar’s compositions?

Most of his compositions were written in Sanskrit.

India-Bangladesh Ganges Water Treaty: Moving Beyond Water Sharing Towards Ecological Conservation

Why in the News?

  • The 30-year Ganges Water-Sharing Treaty signed between India and Bangladesh in 1996 is set to expire in December 2026.
  • On November 3, 2026, Ministry of External Affairs (MEA) spokesperson Randhir Jaiswal stated that both countries have an institutional mechanism to discuss issues concerning all shared rivers, including the Ganges.
  • The Joint Rivers Commission (JRC) serves as the institutional mechanism for discussions on transboundary rivers.
  • India has invited Bangladesh Prime Minister Tarique Rahman to visit New Delhi. However, there has been no official update regarding the renewal of the treaty or the dates of his visit.
  • Against this backdrop, climate change, river ecology and flood management are expected to become important issues in the upcoming negotiations, alongside water sharing.

What is the Ganges Water-Sharing Treaty?

  • The Ganges Water-Sharing Treaty was signed between India and Bangladesh on December 12, 1996.
  • The agreement was concluded under the leadership of Indian Prime Minister H.D. Deve Gowda and Bangladesh Prime Minister Sheikh Hasina.
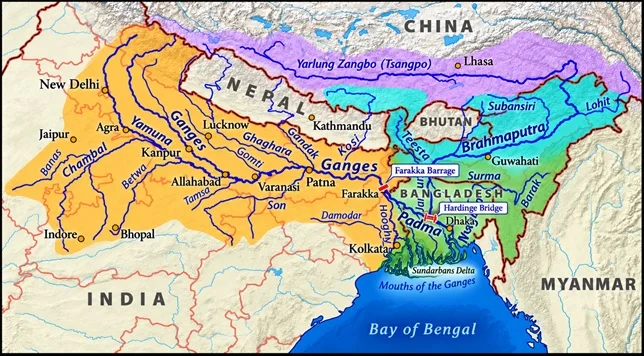
  • Its primary objective is to share the available water of the Ganges during the dry season through the Farakka Barrage in West Bengal.

Key Features of the Treaty

  • Duration: 30 years (1996–2026).
  • Expiry Date: December 12, 2026.
  • River: Ganges (known as the Padma in Bangladesh).
  • Water-Sharing Period: January 1 to May 31 every year.
  • Water Measurement Points: Farakka Barrage (India) and Hardinge Bridge (Bangladesh).

Water-Sharing Mechanism Under the Treaty

Under the treaty, the available water of the Ganges at the Farakka Barrage is distributed between the two countries in successive 10-day periods.

  • When water availability is 70,000 cusecs or less: The water is shared equally between India and Bangladesh.
  • When water availability is between 70,000 and 75,000 cusecs: Bangladesh receives 35,000 cusecs, while India receives the remaining water.
  • When water availability exceeds 75,000 cusecs: India receives 40,000 cusecs, while Bangladesh receives the remaining water.
  • Special Provision: If the water flow falls below 50,000 cusecs, both governments are required to enter into immediate consultations.

Significance of the Farakka Barrage

The Farakka Barrage is an important water infrastructure project located on the Ganges River in West Bengal. It was primarily constructed to maintain water flow in the Hooghly River and improve the navigability of the Kolkata Port.

Major Objectives:

  • Maintaining adequate water flow in the Hooghly River.
  • Helping reduce silt accumulation in the Kolkata-Haldia port system.
  • Regulating and utilising river water.
  • Meeting irrigation and other water requirements of West Bengal.

However, the impact of the Farakka Barrage on river flows and sediment movement has remained a subject of discussion between India and Bangladesh.

Major Causes of the Ganges Water Dispute Between India and Bangladesh

  1. Water Scarcity During the Dry Season: River flows decline between January and May. During this period, both countries have significant agricultural, drinking water and industrial requirements.
  2. Demand for Minimum Water Guarantees: Bangladesh seeks to ensure a guaranteed minimum quantity of water during the dry season. For India, providing such a guarantee is challenging due to natural variations in water availability and domestic requirements.
  3. Impact of the Farakka Barrage: Bangladesh believes that the Farakka Barrage affects the natural flow and hydrological characteristics of the river.
  4. Climate Change: Unpredictable monsoon patterns, glacier melting and changing rainfall patterns are affecting the flow of the Ganges.
  5. Political and Diplomatic Challenges: Political transitions, border management, security concerns and other bilateral issues can influence negotiations over the water-sharing agreement.

Major Environmental Issues Associated with the Ganges Water Treaty

The major limitation of the Ganges Water Treaty is its primary focus on the quantitative distribution of water, with insufficient attention to river ecology and sediment management.

  1. Sediment Imbalance: The Ganges carries large quantities of sediments from the Himalayas. These sediments play an important role in floodplain formation, delta development and maintaining soil fertility. Barrages and other human interventions can affect their natural movement.
  2. Impact on the Sundarbans: The Sundarbans, located within the Ganges-Brahmaputra-Meghna Delta, faces challenges such as sea-level rise, coastal erosion and saltwater intrusion.
  3. Impact on Agriculture and Fisheries: Reduced freshwater availability can increase soil salinity, adversely affecting agricultural production, fisheries and local livelihoods.
  4. Degradation of River Ecology: Changes in river flow can affect aquatic biodiversity, fish breeding patterns and the natural river ecosystem.
  5. Flood and Silt Management: Sediment accumulation, riverbank erosion and changes in river channels increase flood management challenges for both countries.

Significance of the Treaty for India and Bangladesh

Significance for India

  • National Water Security: The Ganges supports agricultural, drinking water and industrial requirements across large parts of northern India.
  • Requirements of West Bengal: Maintaining adequate water flow in the Hooghly River and protecting the Kolkata-Haldia port system and Sundarbans ecosystem are important Indian interests.
  • Regional Stability: Stronger relations with Bangladesh are consistent with India's Neighbourhood First Policy.
  • Regional Connectivity: Cooperation with Bangladesh can strengthen trade, transportation and regional connectivity, particularly with India's Northeast.

Significance for Bangladesh

  • Agriculture and Food Security: Ganges water is important for irrigation and agricultural production.
  • Drinking Water Availability: Ensuring adequate freshwater availability during the dry season is essential.
  • Environmental Conservation: Freshwater flows are important for protecting the Sundarbans' mangrove forests, aquatic biodiversity and delta ecosystem.
  • Livelihoods: Agriculture, fisheries and other river-based economic activities depend on the Ganges' water flows.

Major Challenges in the Renewal of the Ganges Water Treaty

  • 1. Changing Political Landscape: Following the removal of Sheikh Hasina from power in 2024, Bangladesh has witnessed a political transition, with a BNP-led government under Tarique Rahman. This has changed the diplomatic environment for negotiations between the two countries.
  • 2. Issue of Minimum Water Availability: Bangladesh seeks a guaranteed minimum water allocation, whereas India needs to consider natural water availability and its domestic requirements.
  • 3. Balancing Internal Interests: Within India, the water requirements of West Bengal, particularly for the Hooghly River and ports, as well as Bihar's concerns regarding flooding, sedimentation and water availability, need to be considered.
  • 4. Growing Chinese Influence: Bangladesh's expanding economic and strategic engagement with China adds another regional dimension to India-Bangladesh water diplomacy.
  • 5. Climate Change Uncertainty: Predicting future river flows is becoming increasingly difficult. Therefore, an agreement based solely on historical water availability may not be sufficient.
  • 6. Neglect of Ecological Requirements: The existing treaty primarily focuses on water quantity. Issues such as sediment transport, natural river variability and environmental flows also need to be incorporated.

Way Forward: Making the Treaty Climate-Resilient

  1. Comprehensive and Long-Term Agreement: Both countries should move beyond water allocation and adopt an agreement based on integrated river basin management.
  2. Ensuring Environmental Flows: Along with water quantity, the timing, quality and seasonal variability of river flows should be considered to maintain ecological balance.
  3. Incorporating Sediment Management: Joint studies should be undertaken to understand the natural movement, distribution and role of Ganges sediments in delta formation.
  4. Joint Scientific Studies: India and Bangladesh should share data concerning river flows, groundwater, rainfall, glaciers, floods and sea-level rise.
  5. Strengthening the Joint Rivers Commission: The Joint Rivers Commission (JRC) should be strengthened through greater technical capacity, regular meetings and an effective dispute-resolution mechanism.
  6. Involving States: The interests of relevant Indian states, particularly West Bengal and Bihar, should be incorporated into India's negotiating position.
  7. Flexible Water-Sharing Mechanism: Given fluctuations in water availability due to climate change, the agreement should include periodic reviews and provisions for emergency consultations.
  8. Trust-Based Diplomacy: Both countries should prioritise cooperation and mutual trust while addressing water disputes independently of broader bilateral tensions.

UPSC Prelims Practice Question 

Q1. With reference to the Ganges Water-Sharing Treaty between India and Bangladesh, consider the following statements:

  1. The treaty was signed in 1996.
  2. The water-sharing arrangement under the treaty operates from January to May every year.
  3. The Joint Rivers Commission serves as a forum for discussions on issues concerning shared rivers between India and Bangladesh.

Which of the statements given above are correct?

(a) 1 and 2 only

(b) 2 and 3 only

(c) 1 and 3 only

(d) 1, 2 and 3

World Tsunami Awareness Day: Theme, Major causes, Natural Warning Signs and India's Tsunami Early Warning System

Why in news?

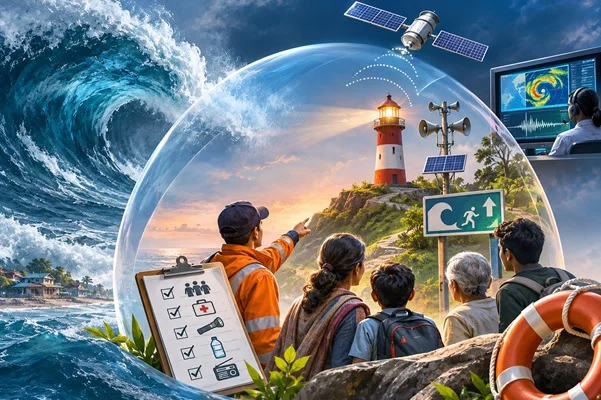
World Tsunami Awareness Day 2026 will be observed on 5 November 2026 across the world.
Key facts 

Particulars

Details

Day

World Tsunami Awareness Day

Date

5 November

First observed

2016

Established by

United Nations General Assembly

Resolution

A/RES/70/203

Theme 2026

Be Tsunami Ready: Resilience Starts With You

Main objective

Promote tsunami awareness and preparedness

Lead UN body

United Nations Office for Disaster Risk Reduction (UNDRR)

Global scientific coordination

UNESCO-IOC

What is a Tsunami?

  • A series of extremely long ocean waves generated by the sudden displacement of a large volume of seawater.
  • The word tsunami originates from Japanese: Tsu (Harbour) and Nami (Wave). 
  • A tsunami may travel across entire ocean basins and cause severe destruction when it reaches shallow coastal waters.

Major causes of tsunamis

Cause

Explanation

Undersea earthquakes

Sudden movement of tectonic plates displaces the ocean floor and pushes large amounts of water.

Volcanic eruptions

Underwater or coastal volcanic eruptions can displace seawater.

Submarine landslides

Large underwater masses of soil and rocks suddenly move, generating waves.

Meteorite impacts

A large object striking the ocean can displace enormous volumes of water.

How does a Tsunami occur?

  • Tectonic movement: An earthquake occurs beneath the ocean due to the movement of tectonic plates.
  • Seafloor displacement: The ocean floor suddenly rises or sinks, displacing the water column above it.
  • Wave generation: The displaced water generates a series of long waves that spread in different directions.
  • Oceanic propagation: The waves travel across the ocean at high speeds, often with relatively small wave heights in deep water.
  • Coastal amplification: As the waves enter shallow coastal waters, they slow down and their height can increase significantly.
  • Coastal inundation: The waves move inland, flooding coastal settlements and damaging infrastructure.

Tsunami vs Normal Ocean Waves

Basis

Normal Ocean Waves

Tsunami

Main cause

Wind

Earthquakes, landslides, volcanic activity

Wavelength

Relatively short

Extremely long

Speed

Generally lower

Can exceed 800 km/h in deep oceans

Energy

Mostly concentrated near the surface

Involves movement of the entire water column

Impact

Usually limited to surface activity

Can cause extensive coastal flooding

Number of waves

Usually individual or continuous wind-driven waves

A series of waves

Why is World Tsunami Awareness Day Observed on 5 November?

  • On 5 November 1854, a Japanese villager named Hamaguchi Goryo noticed signs of an approaching tsunami.
  • He set fire to his harvested rice sheaves to alert villagers and guide them towards higher ground.
  • This action helped save the lives of many people.
  • The incident became an important example of community-based disaster preparedness and the importance of recognising natural warning signs.
  • In December 2015, the United Nations General Assembly adopted Resolution A/RES/70/203, designating 5 November as World Tsunami Awareness Day. The first observance took place in 2016. 

What are the Natural Warning Signs of a Tsunami?

Warning sign

What it indicates

Strong or prolonged earthquake

Possible undersea tectonic activity

Sudden rise or withdrawal of seawater

Possible tsunami approaching the coast

Loud roaring sound from the ocean

Possible approaching tsunami waves

Unusual behaviour of the sea

Potential coastal hazard

Why are Tsunamis a Major Global Concern?

Area

Impact

Human life

Large-scale deaths, injuries and displacement

Infrastructure

Destruction of houses, roads, bridges, ports and communication networks

Economy

Damage to fisheries, tourism, agriculture and coastal industries

Environment

Coastal erosion, saltwater intrusion and destruction of marine ecosystems

Agriculture

Salinization of agricultural land and contamination of freshwater sources

Public health

Risk of waterborne diseases, sanitation problems and psychological trauma

Major Tsunami Disasters in History 

Year

Location

Significance

1960

Chile

The Great Chilean Earthquake generated a trans-Pacific tsunami.

2004

Indian Ocean

One of the deadliest tsunamis in recorded history, affecting several countries.

2011

Japan

The Tohoku earthquake triggered a devastating tsunami and the Fukushima nuclear accident.

India's Vulnerability to Tsunamis

  • India has a coastline of approximately 7,516.6 km, including its mainland and island territories. 
  • Its geographical location exposes it to tsunami risks originating from seismic activities in the Indian Ocean region.

Region

Tsunami vulnerability

Andaman and Nicobar Islands

Located close to the seismically active Sunda subduction zone.

Tamil Nadu

Exposed to tsunami waves originating from the eastern Indian Ocean.

Andhra Pradesh

Vulnerable due to its long Bay of Bengal coastline.

Odisha

Coastal settlements are exposed to multiple ocean-related hazards.

Kerala

Vulnerable to tsunami waves originating in the Indian Ocean.

Pondicherry

Its coastal location creates exposure to tsunami-related hazards.

India's Tsunami Early Warning System

  • Following the devastating Indian Ocean Tsunami of 2004, India established a dedicated tsunami early warning system to improve monitoring, forecasting and disaster preparedness. The system became fully operational in October 2007.
  • Indian Tsunami Early Warning Centre (ITEWC)
  • Established at the Indian National Centre for Ocean Information Services (INCOIS), Hyderabad.
  • Operates under the Ministry of Earth Sciences (MoES).
  • Functions as India's national authority for issuing tsunami advisories.
  • Operates 24 hours a day, seven days a week.
  • Monitors seismic activity and sea-level changes to identify potential tsunami threats.

How does India's Tsunami Early Warning System work?

Component

Function

Seismic stations

Detect earthquakes and determine their magnitude and location.

Bottom Pressure Recorders (BPRs)

Detect changes in water pressure at the ocean floor.

Tsunami buoys

Transmit ocean measurements to monitoring centres.

Tide gauges

Measure changes in sea level along coastlines.

Numerical models

Estimate tsunami propagation and potential coastal impact.

Warning centre

Analyses data and issues tsunami advisories to relevant authorities.

Major Global Initiatives for Tsunami Preparedness

Initiative

Organisation

Objective

World Tsunami Awareness Day

UN General Assembly

Promote global tsunami awareness and preparedness.

Sendai Framework for Disaster Risk Reduction (2015–2030)

United Nations

Reduce disaster risks and losses through prevention, preparedness and resilience.

Tsunami Ready Programme

UNESCO-IOC

Strengthen community-level tsunami preparedness.

Early Warnings for All (EW4All)

United Nations

Ensure that everyone is protected by early warning systems.

Indian Ocean Tsunami Warning and Mitigation System (IOTWMS)

UNESCO-IOC

Coordinate tsunami warning and mitigation across the Indian Ocean.

Prelims MCQ

Q. Consider the following statements regarding tsunamis:

  1. Tsunamis are primarily generated by underwater earthquakes.
  2. The Indian Tsunami Early Warning Centre is located in Hyderabad.
  3. UNESCO-IOC coordinates regional tsunami warning systems.
  4. Tsunamis are caused exclusively by earthquakes.

Which of the statements given above are correct?

(a) 1 and 2 only

(b) 1, 2 and 3 only

(c) 2 and 4 only

(d) All four

Mains Practice Question

Q. Discuss the role of early warning systems and disaster resilience in reducing tsunami-related risks, with special reference to India.

FAQs

When is World Tsunami Awareness Day observed?

5 November every year.

What is the theme of World Tsunami Awareness Day 2026?

Be Tsunami Ready: Resilience Starts With You.

Which organisation coordinates global tsunami warning systems?

UNESCO's Intergovernmental Oceanographic Commission (IOC).

Where is India's Tsunami Early Warning Centre located?

INCOIS, Hyderabad.

Which disaster led India to establish its tsunami early warning system?

The Indian Ocean Tsunami of 26 December 2004.

International Day against Violence and Bullying at School: Theme, Major laws and organisations, Challenges

Why in news?

The International Day against Violence and Bullying at School, including Cyberbullying, is observed every year on the first Thursday of November. In 2026, it will be observed on 5 November.

Key Facts

Particular

Details

Official Name

International Day against Violence and Bullying at School, including Cyberbullying

Observed On

First Thursday of November

2026 Date

5 November 2026

Established By

UNESCO Member States

First Observed

2020

Nature

International observance

Main Focus

Prevention of school violence and bullying

UN Agency

UNESCO

2026 Theme 

Every learner safe and well: From promise to practice

Understanding School Violence and Bullying

  • School violence refers to any form of physical, psychological or sexual violence that occurs in or around educational institutions, including online spaces connected with education.
  • Major forms are: 

Type

Explanation

Examples

Physical Bullying

Physical harm or intimidation

Hitting, pushing and kicking

Verbal Bullying

Use of abusive or insulting language

Name-calling, threats and mocking

Psychological Bullying

Causing emotional or mental distress

Humiliation, intimidation and social exclusion

Cyberbullying

Harassment through digital platforms

Abusive messages, online threats and sharing embarrassing content

Sexual Harassment

Unwanted sexual behaviour

Inappropriate comments, gestures or touching

Discriminatory Bullying

Targeting someone based on identity or background

Bullying based on disability, gender, caste or other differences

What is Cyberbullying?

  • Cyberbullying refers to the use of digital technologies to threaten, harass, humiliate or intimidate another person.
  • It can occur through social media platforms, online gaming platforms, e-mails and digital discussion forums and sharing private photographs or personal information without consent.

Global Scenario: Important Statistics

Indicator

Global Situation

School Bullying

Around 1 in 3 learners experiences bullying every month.

Physical Fights

More than 36% of learners experience physical fights with peers.

Physical Attacks

Almost 1 in 3 learners experiences a physical attack at least once a year.

Cyberbullying

As many as 1 in 10 children are affected by cyberbullying.

Sexual Violence

Estimates indicate that 1 in 5 girls and 1 in 7 boys experience some form of sexual violence during childhood.

Impact of Bullying on Students

  • Mental Health Problems: Anxiety, depression, stress and loss of self-confidence.
  • Poor Academic Performance: Difficulty concentrating, declining grades and reduced classroom participation.
  • School Absenteeism: Victims may avoid school due to fear and insecurity.
  • Social Isolation: Difficulty developing friendships and trusting others.
  • Long-term Consequences: Emotional trauma and difficulties in social relationships may continue into adulthood.

International Frameworks and Initiatives

Framework / Initiative

Key Provisions

UN Convention on the Rights of the Child (UNCRC), 1989

Protects children's rights to education, dignity and freedom from violence.

Sustainable Development Goal 4 (SDG 4)

Ensures inclusive and equitable quality education.

SDG Target 4.a

Calls for safe, non-violent, inclusive and effective learning environments.

UNESCO's Global Education Coalition

Promotes cooperation among education stakeholders to address educational challenges.

UNESCO's Safe Learning Environments Initiative

Focuses on preventing and addressing violence in and around schools.

India's Efforts to Prevent School Violence and Bullying

A. Constitutional Provisions

Article

Constitutional Provision

Relevance

Article 14

Equality before law

Protection against discrimination.

Article 15

Prohibition of discrimination

Promotes equal treatment.

Article 21

Protection of life and personal liberty

Includes the right to live with dignity.

Article 21A

Right to Education

Provides free and compulsory education for children aged 6-14 years.

Article 39(f)

Directive Principles of State Policy

Directs the State to ensure opportunities for children to develop in a healthy manner and with dignity.

Article 45

Early Childhood Care and Education

Provides for early childhood care and education for children below six years.

B. Important Laws and Guidelines

  • Right to Education (RTE) Act, 2009
    • Section 17 prohibits physical punishment and mental harassment of children.
    • Violations may lead to disciplinary action under applicable service rules.
    • Section 31 provides for monitoring of children's right to education.
  • Protection of Children from Sexual Offences (POCSO) Act, 2012
    • Protects children below 18 years from sexual assault, sexual harassment and pornography.
    • Provides for child-friendly procedures and Special Courts.
    • Section 19 provides for mandatory reporting of offences covered by the Act.
  • National Commission for Protection of Child Rights (NCPCR)
    • Established under the Commission for Protection of Child Rights Act, 2005.
    • Works to protect and promote children's rights.
    • Provides guidelines and recommendations for preventing bullying and cyberbullying in schools.
  • Guidelines on School Safety and Security, 2021
    • Developed by the Department of School Education and Literacy, Ministry of Education.
    • Applicable to government, government-aided and private schools.
    • Emphasises reporting incidents of physical violence, sexual violence, bullying and injuries.
    • These guidelines are advisory in nature.
  • NCPCR Guidelines for Preventing Bullying and Cyberbullying
    • NCPCR has issued specific guidelines for schools.
    • Focuses on prevention, identification, reporting and response mechanisms.
    • Encourages schools to establish a safe and supportive environment for children.

C. Important Institutions

Institution

Role

NCPCR

Protects and monitors children's rights at the national level.

SCPCR

Protects children's rights at the state level.

CBSE

Issues school-related academic & safety guidelines for affiliated schools.

Ministry of Education

Develops policies and guidelines for school education.

UNESCO

Promotes global cooperation to eliminate violence and bullying in education.

Major Challenges in Eliminating School Bullying

  • Lack of Awareness: Students, parents and teachers may not recognise psychological bullying and cyberbullying.
  • Weak Implementation: School safety guidelines may not be effectively implemented in every institution.
  • Digital Challenges: Anonymous accounts, fake profiles and rapid circulation of harmful content make cyberbullying difficult to control.
  • Lack of Counsellors: Many schools do not have adequate trained mental-health professionals.
  • Social Discrimination: Caste, gender, disability, economic background and other forms of prejudice can increase students' vulnerability.

Prelims MCQ

Q. The International Day against Violence and Bullying at School, Including Cyberbullying, is observed on:

A. First Monday of November

B. First Thursday of November

C. Second Wednesday of November

D. 10 November

Mains Practice Question

Q. Examine the role of constitutional provisions, the RTE Act, 2009 and the POCSO Act, 2012 in protecting children from violence and harassment.

FAQs

When is the International Day against Violence and Bullying at School observed?

First Thursday of November every year.

Which organisation established this day?

UNESCO Member States.

When was this day first observed?

5 November 2020.

What is the theme for 2026?

Every learner safe and well: From promise to practice.

Which provision of the RTE Act prohibits physical punishment and mental harassment?

Section 17 of the Right of Children to Free and Compulsory Education Act, 2009.

National Stress Awareness Day: Theme, Major Causes, Effects on Mental Health, India's Efforts and Challenges

Why in news?

National Stress Awareness Day is observed every year on the first Wednesday of November. In 2026, it is being observed on 4 November.

Key Facts

Particular

Details

Name

National Stress Awareness Day

Observed On

First Wednesday of November

2026 Date

4 November 2026

Founded By

International Stress Management Association (ISMA)

Established In

1998

Origin

United Kingdom

Main Objective

Awareness about stress and its management

Related Area

Mental Health and Well-being

Related International Campaign

International Stress Awareness Week

2026 Theme

Shaping the Future of Stress and Wellbeing: Rehumanising the Workplace

Understanding Stress

  • Stress is the physical and psychological response of the body to situations perceived as challenging, demanding or threatening.
  • It activates the body's stress-response system, preparing an individual to respond to a perceived challenge.

Type

Meaning

Example

Acute Stress

Short-term stress arising from an immediate challenge

Examination, interview or public speaking

Episodic Acute Stress

Repeated episodes of acute stress

Frequent deadlines and continuous pressure

Chronic Stress

Long-lasting stress due to persistent difficulties

Long-term financial or workplace problems

Eustress

Positive or motivating stress

Excitement before a competition or important achievement

Major Causes of Stress

Category

Major Causes

Academic Stress

Examinations, competition, parental expectations and fear of failure

Workplace Stress

Excessive workload, job insecurity and unrealistic deadlines

Financial Stress

Debt, unemployment, inflation and financial uncertainty

Family Stress

Relationship conflicts, caregiving responsibilities and family disputes

Social Stress

Social isolation, discrimination and peer pressure

Digital Stress

Excessive screen time, information overload and constant online connectivity

Health-related Stress

Chronic illness, health concerns and uncertainty about the future

Effects of Stress on Human Health

  • Physical Effects
  • Headaches and muscle tension.
  • Sleep disturbances and fatigue.
  • Digestive problems.
  • Increased heart rate and blood pressure.
  • Changes in appetite.
  • Psychological Effects
  • Anxiety and persistent worry.
  • Irritability and mood changes.
  • Difficulty concentrating.
  • Emotional exhaustion.
  • Reduced motivation.
  • Social and Professional Effects
  • Reduced productivity at work.
  • Conflicts in personal relationships.
  • Social withdrawal.
  • Increased absenteeism.
  • Reduced quality of life.

Global Scenario: Stress and Workplace Well-being

Indicator

Global Data

Working-age adults with a mental disorder

Estimated 16% in 2023

Annual working days lost due to depression and anxiety

Approximately 12 billion

Annual global productivity loss

Approximately US$1 trillion

Major workplace risk factors

Excessive workload, job insecurity, discrimination and lack of support

India's Efforts to Address Stress and Mental Health

  • National Mental Health Programme (NMHP)
    • Launched in 1982.
    • Aims to make mental healthcare accessible and affordable.
    • Focuses on integrating mental health services into the general healthcare system.
    • Promotes awareness, prevention, treatment and rehabilitation.
  • District Mental Health Programme (DMHP)
    • Introduced under the National Mental Health Programme.
    • Provides mental healthcare services at the district level.
    • Focuses on early identification, treatment and rehabilitation.
    • Includes awareness and counselling activities in schools and workplaces.
  • Tele-MANAS
    • Launched: 10 October 2022.
    • Tele-MANAS: Tele Mental Health Assistance and Networking Across States
    • Ministry: Ministry of Health and Family Welfare.
    • Objective: Provide accessible mental-health counselling and support through telecommunication.
    • Helpline: 14416.
    • Provides 24×7 mental-health support.
  • National Health Mission (NHM)
    • Supports the delivery of healthcare services across India.
    • Promotes mental-health awareness and community-level interventions.
    • Supports training and capacity building for healthcare workers.
  • Ayushman Arogya Mandirs
    • Promote comprehensive primary healthcare.
    • Include mental-health services within the broader primary healthcare framework.
    • Improve access to healthcare at the community level.

Major Challenges in Stress Management

  • Social Stigma: People hesitate to discuss mental-health concerns due to fear of judgement.
  • Workplace Pressure: Long working hours, excessive workload and job insecurity contribute to stress.
  • Academic Competition: Examination pressure and expectations can affect students' emotional well-being.
  • Limited Accessibility: Mental-health professionals and services are not equally accessible across all regions.
  • Digital Overload: Excessive screen exposure and constant connectivity can affect rest and work-life balance.

Prelims MCQ

Q. National Stress Awareness Day was founded by which organisation?

A. WHO

B. UNICEF

C. International Stress Management Association

D. UNESCO

Mains Practice Questions

Q. "Emotional intelligence and effective stress management are essential qualities for public servants." Discuss.

FAQs

When is National Stress Awareness Day observed?

First Wednesday of November every year.

Who founded National Stress Awareness Day?

The International Stress Management Association (ISMA) in 1998.

What is the 2026 campaign theme?

Shaping the Future of Stress and Wellbeing: Re-humanising the Workplace.

When was India's National Mental Health Programme launched?

1982.

Which organisation provides international guidelines on mental health at work?

The World Health Organization (WHO).

India Renewable Energy Market Report 2026

GS Paper III: Infrastructure, Energy Security, Renewable Energy, Environment and Sustainable Development
Keywords: India Renewable Energy Market Report 2026, International Energy Agency (IEA), Renewable Energy Capacity, Solar PV Manufacturing, Energy Security, Green Energy Transition, 500 GW Non-Fossil Capacity, Biofuels, Solar Power, Net Zero 2070

Why in News?

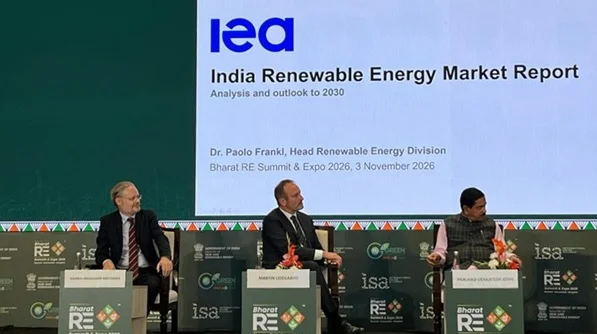
  • On 3 November 2026, the International Energy Agency (IEA) released the India Renewable Energy Market Report 2026 at the Bharat Renewable Energy Summit in New Delhi.
  • According to the report, India's installed renewable electricity capacity surpassed 300 GW in 2026, almost quadrupling over the past decade.
  • India has emerged as the world's second-fastest-growing renewable energy market and the second-largest manufacturer of solar photovoltaic (PV) modules.
  • The report highlights that renewable electricity helped India save more than USD 100 billion in coal and natural gas import costs between 2011 and 2025.

Key Facts at a Glance

Particular

Details

Report

India Renewable Energy Market Report 2026

Released by

International Energy Agency (IEA)

Release date

3 November 2026

Launch venue

Bharat Renewable Energy Summit, New Delhi

India's global renewable market rank

2nd fastest-growing

Solar PV module manufacturing

2nd largest globally

Renewable power capacity (2026)

Over 300 GW

Renewable capacity forecast (2030)

Around 530 GW

Solar PV capacity forecast (2030)

Over 350 GW

Wind capacity forecast (2030)

Nearly 90 GW

Hydropower capacity forecast (2030)

Around 75 GW

Import cost savings (2011–2025)

Over USD 100 billion

Non-fossil installed capacity milestone

50% achieved in 2025

India's non-fossil capacity target (2030)

500 GW

Net-zero emissions target

2070

Key Findings of the IEA Report 2026

1. Rapid Growth in Renewable Energy Capacity

  • India's renewable electricity capacity increased nearly fourfold over the past decade, exceeding 300 GW in 2026.
  • Solar energy has emerged as the primary driver of India's renewable electricity expansion.
  • According to IEA projections, renewable capacity will reach approximately 530 GW by 2030.
  • Solar PV is expected to account for more than 80% of renewable capacity additions during the forecast period.

2. Strengthening India's Energy Security

  • Renewable electricity reduced India's cumulative coal and natural gas import expenditure by more than USD 100 billion between 2011 and 2025.
  • Without solar, wind and bioenergy capacity added since 2010, India's coal imports in 2025 would have been approximately 110 million tonnes higher.
  • Biofuels also reduced India's crude oil import dependence by approximately four percentage points in 2025.
  • The expansion of domestic renewable energy reduces India's exposure to international fuel price volatility and supply disruptions.

3. Expansion of Renewable Electricity Generation

  • Renewable electricity generation exceeded 500 terawatt-hours (TWh) in 2025, representing approximately 25% of India's electricity supply.
  • Renewable electricity generation is expected to approach 950 TWh by 2030.
  • Renewables are projected to supply around 35% of India's total electricity by 2030.
  • Solar PV overtook hydropower as India's largest renewable electricity source in 2025.

4. India's Growing Solar Manufacturing Industry

  • India has become the world's second-largest manufacturer of solar PV modules.
  • Annual solar PV module manufacturing capacity reached approximately 225 GW in September 2026.
  • Government policies, including the Production Linked Incentive (PLI) Scheme and domestic sourcing requirements, have encouraged manufacturing investment.
  • Domestic manufacturing expansion offers opportunities to diversify global clean energy supply chains and reduce import dependence.

5. Competitive Renewable Energy Costs

  • Competitive auctions have contributed to declining renewable electricity prices in India.
  • India's utility-scale solar PV projects have the world's second-lowest levelised generation costs, estimated at USD 30–35 per megawatt-hour.
  • Solar PV tariffs for projects commissioned in 2025 were approximately 40% below the average cost of coal-fired electricity.
  • Lower renewable electricity costs can improve energy affordability and support industrial competitiveness.

6. Growth of Hybrid Renewable Energy Projects

  • India has emerged as a global leader in procuring hybrid renewable energy projects combining technologies such as solar, wind and energy storage.
  • In 2025, India auctioned 15 GW of hybrid renewable projects, increasing cumulative auctioned capacity to 64 GW.
  • Hybrid projects can reduce variability in power generation and improve the utilisation of transmission infrastructure.
  • Their expansion supports the integration of renewable energy into India's electricity grid.

7. Expansion of Biofuels and Clean Transport

  • India's liquid biofuel production increased sixfold between 2020 and 2025.
  • Liquid biofuel consumption reached approximately 11 billion litres in 2025 and is projected to reach 16 billion litres by 2030.
  • India became the world's fourth-largest liquid biofuel market.
  • Electric vehicles accounted for more than 11% of new vehicle sales in 2026, reflecting growing electrification of the transport sector.

8. Renewable Energy Targets and Future Outlook

  • India achieved 50% non-fossil fuel-based installed electricity capacity in 2025, five years ahead of its 2030 target.
  • The IEA expects India to meet its target of 500 GW of non-fossil electricity capacity by 2030.
  • Continued progress will require stronger electricity grids, additional storage capacity and improved power distribution infrastructure.
  • Addressing infrastructure and regulatory challenges could accelerate renewable capacity deployment by more than 20% during 2026–2030.

India's Renewable Energy Outlook: 2025–2030

Indicator

2025–2026

2030 Projection

Renewable power capacity

Over 300 GW (2026)

Around 530 GW

Solar PV capacity

—

Over 350 GW

Wind power capacity

—

Nearly 90 GW

Hydropower capacity

—

Around 75 GW

Renewable electricity generation

Over 500 TWh (2025)

Nearly 950 TWh

Renewable share in electricity generation

Around 25% (2025)

Around 35%

Liquid biofuel consumption

11 billion litres (2025)

16 billion litres

Source: IEA 2026. A dash indicates that the corresponding baseline was not specified in the report summary. 

Significance for India

1. Energy Security

  • Renewable energy reduces dependence on imported coal, natural gas and petroleum-based fuels.
  • Domestic clean energy generation can improve resilience against geopolitical conflicts and international supply disruptions.

2. Economic Development

  • Expansion of renewable energy supports investment in manufacturing, power infrastructure and associated services.
  • Competitive renewable electricity costs can strengthen India's long-term industrial competitiveness.

3. Climate Change Mitigation

  • Greater renewable electricity generation helps reduce dependence on carbon-intensive energy sources.
  • It supports India's nationally determined climate commitments and net-zero emissions ambition for 2070.

4. Global Energy Leadership

  • India's position as a major renewable energy market increases its importance in international energy cooperation.
  • Expansion of solar and wind manufacturing creates opportunities for India to participate more strongly in global clean technology supply chains.

5. Employment and Rural Development

  • Renewable energy projects can create employment opportunities in manufacturing, installation, operations and maintenance.
  • Rooftop solar and agricultural solarisation programmes can improve energy access and support rural development.

Challenges

  • Grid Infrastructure: Rapid renewable expansion requires significant investment in transmission networks and electricity distribution systems.
  • Energy Storage: Intermittent solar and wind generation requires batteries, pumped storage and other flexibility solutions.
  • Financial Constraints: Weak finances of electricity distribution companies (DISCOMs) can reduce investor confidence.
  • Land Acquisition: Land availability, environmental clearances and project implementation delays affect renewable projects.
  • Supply Chain Dependence: India remains exposed to concentrated global supply chains for certain upstream solar manufacturing components.
  • System Integration: Increasing variable renewable electricity generation requires improved forecasting, dispatch and grid management.

Way Forward

  • Modernise Electricity Grids: Accelerate the expansion of transmission infrastructure and Green Energy Corridors.
  • Expand Storage Capacity: Encourage battery energy storage systems and pumped-storage hydropower projects.
  • Strengthen Domestic Manufacturing: Promote domestic manufacturing of solar cells, wafers and other strategic clean energy components.
  • Improve DISCOM Finances: Implement financial and operational reforms to ensure reliable electricity distribution and timely payments.
  • Support Distributed Renewable Energy: Expand rooftop solar, agricultural solarisation and decentralised renewable energy systems.
  • Accelerate Clean Fuel Development: Strengthen sustainable biofuel, compressed biogas and green hydrogen supply chains.

Conclusion

India's renewable energy expansion represents a significant transformation in its energy sector. According to the IEA's India Renewable Energy Market Report 2026, the country has emerged as a major global clean energy market while achieving substantial fuel import savings and expanding domestic manufacturing. However, sustained progress will depend on grid modernisation, energy storage, financial reforms and efficient project implementation. Strengthening these areas will be essential for achieving India's 2030 energy targets and long-term energy security.

Prelims Practice Question

Q. Consider the following statements regarding the India Renewable Energy Market Report 2026:

  1. India has emerged as the world's second-fastest-growing renewable energy market.
  2. India's renewable power capacity surpassed 300 GW in 2026.
  3. India is projected to achieve approximately 530 GW of renewable power capacity by 2030.

Which of the statements given above are correct?

(a) 1 and 2 only

(b) 2 and 3 only

(c) 1 and 3 only

(d) 1, 2 and 3

Mains Practice Question

Q. Examine the role of renewable energy expansion in strengthening India's energy security and economic development. Discuss the major challenges in achieving India's renewable energy targets by 2030.

FAQs

Q1. What is the India Renewable Energy Market Report 2026?

It is a report published by the International Energy Agency on 3 November 2026, examining India's renewable energy growth, energy security benefits, manufacturing expansion and outlook to 2030.

Q2. What is India's position in the global renewable energy market?

According to the IEA, India is the world's second-fastest-growing renewable energy market and second-largest solar PV module manufacturer.

Q3. How much renewable energy capacity did India achieve in 2026?

India's installed renewable electricity capacity surpassed 300 GW in 2026.

Q4. What is India's renewable energy capacity projection for 2030?

The IEA projects approximately 530 GW of installed renewable electricity capacity by 2030, including over 350 GW of solar PV capacity.

Q5. What is India's net-zero emissions target?

India aims to achieve net-zero greenhouse gas emissions by 2070.

upsc english
« »
  • SUN
  • MON
  • TUE
  • WED
  • THU
  • FRI
  • SAT